blask
Greece Led Europe’s iGaming Growth in 2025 — Now the Drivers Are Fully Explained
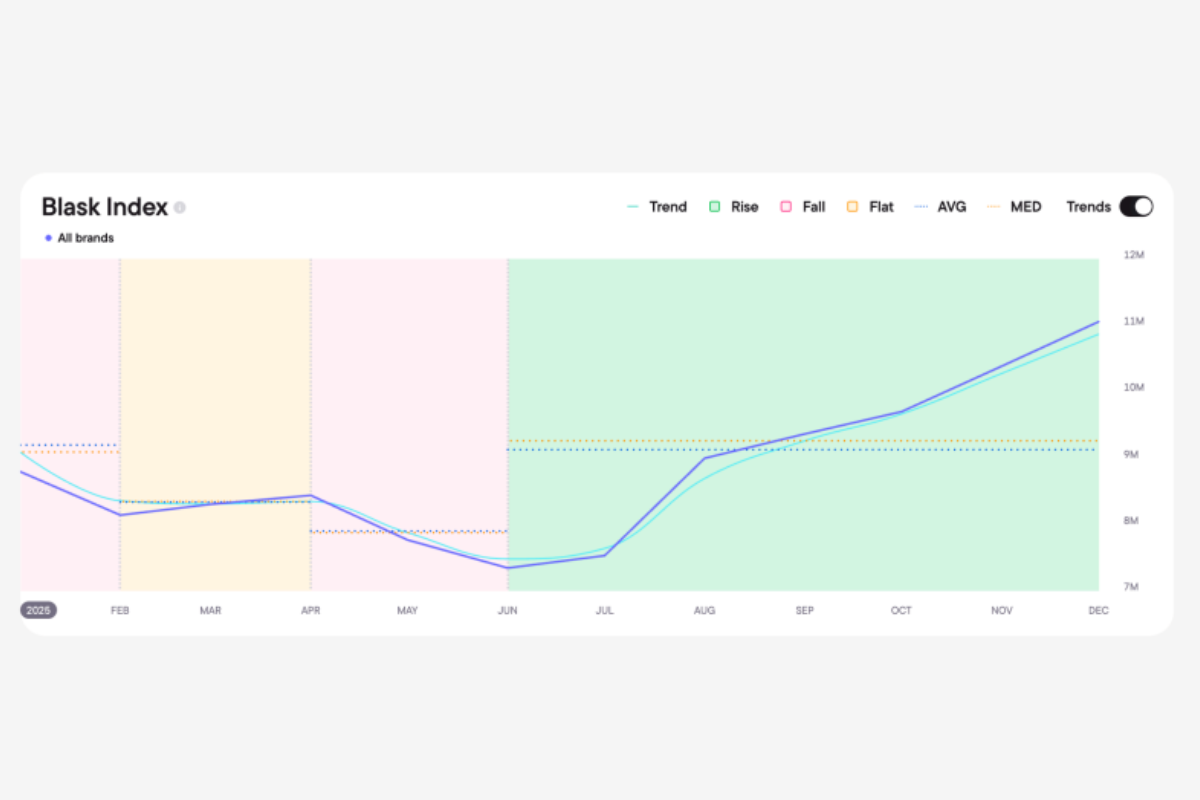
In the second half of 2025, Greece emerged as Europe’s fastest-growing iGaming market. While several major jurisdictions slowed or declined, Greek market demand rose by more than 50% between June and December, standing out as one of the year’s clearest growth stories.
According to data from Blask, the surge was not the result of a single tournament or seasonal spike. Instead, it reflected a structural shift driven by a combination of sports momentum, regulatory reform and casino market dynamics — factors that can now be traced in detail through Blask’s newly released Market Explanation feature.
Continuous sports momentum without demand gaps
Greece’s growth was underpinned by a tightly stacked sports calendar that sustained engagement across multiple months. EuroBasket 2025 in late August, the kickoff of the Stoiximan Super League, UEFA Champions League matchdays under the new league-phase format, and the EuroLeague season featuring Greek clubs created a continuous rhythm of high-interest betting cycles throughout autumn.
Rather than short-lived peaks followed by sharp declines, demand remained elevated well beyond individual events. This is a pattern clearly visible on the Blask Index trend line.
Casino reform reshaped demand behavior
One of the most significant contributors came from the casino segment. Greece’s decision to raise RNG stake limits from €2 to €20 altered the mechanics of the market, allowing online casinos to absorb demand during sports off-peak periods.
As sports-led acquisition increasingly converted into casino play, operators reported double-digit iGaming growth. Market Explanation analysis shows that this effect persisted over time, confirming the shift as structural rather than seasonal.
Enforcement redirected demand to licensed operators
Regulatory action further reinforced the upward trend. In December, Greek authorities blocked approximately 11,000 illegal gambling domains. Instead of suppressing demand, the move redirected player interest toward licensed platforms, strengthening regulated market performance.
The impact was amplified by the adoption of IRIS instant payments, which reduced deposit friction and improved conversion from interest to activity.
From tracking trends to understanding causes
To surface these drivers, Blask has introduced Market Explanation — an AI-powered layer within the Blask Index that allows users to click on any country’s trend line and instantly see a sourced breakdown of the forces behind the movement. Sports calendars, regulatory changes, casino dynamics and macro factors are analyzed together, turning raw demand signals into actionable market context.
Greece’s 2025 performance illustrates how this approach changes market analysis. Rather than simply observing that demand is rising, operators, suppliers and investors can now see why it is happening — and which levers are shaping the trajectory of a market in real time.
The post Greece Led Europe’s iGaming Growth in 2025 — Now the Drivers Are Fully Explained appeared first on Eastern European Gaming | Global iGaming & Tech Intelligence Hub.


American online gambling
New Analysis Shows Majority of Online Gambling Operators Targeting U.S. Players are Unlicensed

According to Blask’s latest analysis of the U.S. iGaming landscape, 290 out of 362 operators active in the American online gambling ecosystem (approximately 80%) are offshore platforms operating outside domestic regulatory frameworks. The data highlights a structural reality of the U.S. market: while regulation has expanded significantly over the past decade, offshore operators still dominate the competitive landscape in terms of brand presence.
This dominance is not limited to the number of operators. It also translates into a substantial share of total market value. Blask estimates that the total U.S. online gambling market reached approximately $79.8B in Competitive Earning Baseline (CEB) in 2025. Of that total, only around $25.2B was captured by licensed domestic operators, while the majority flowed to offshore platforms.
In other words, roughly three quarters of the U.S. market value remains outside the regulated ecosystem, despite more than a decade of state-by-state legalization.
The persistence of offshore dominance is closely tied to the fragmented structure of U.S. gambling regulation. Several of the country’s largest markets still operate without any online gambling legalization, while many regulated states allow sports betting but not online casinos — creating structural gaps that offshore platforms continue to fill.
States that offer full online gambling regulation, including both sports betting and casino, show significantly lower offshore penetration. Markets such as New Jersey and Michigan capture roughly three quarters of their online gambling value domestically, demonstrating that comprehensive regulation can meaningfully increase channelization. However, no U.S. jurisdiction has fully eliminated offshore activity.
The post New Analysis Shows Majority of Online Gambling Operators Targeting U.S. Players are Unlicensed appeared first on Americas iGaming & Sports Betting News.
2025 U.S. iGaming landscape analysis
Full regulation doesn’t kill offshore but cuts it by more than half, Blask data show

Legalization in the United States does not eliminate offshore gambling activity but dramatically reduces it. According to Blask’s 2025 U.S. iGaming landscape analysis, fully regulated states offering both online casino and sports betting see offshore market share drop to approximately 38% on average.
By contrast, betting-only states average around 74% offshore share, while unregulated states send 100% of their online gambling value offshore by definition. The data suggests a clear structural pattern: regulation significantly improves channelization — but it is not a binary switch.
National context: 77% offshore
Across all analyzed U.S. states, the national average offshore share stands at 79%, compared to 21% domestic. Even after more than a decade of state-level legalization, offshore platforms still capture the majority of U.S. online gambling value.
However, the distribution varies dramatically depending on the regulatory model.
Fully regulated states: majority domestic
States that have legalized both online casino and sports betting show the strongest domestic capture rates.
- New Jersey captures approximately 73% of its market domestically.
- Michigan captures roughly 75% domestically.
- Across fully regulated states, domestic share averages near 62%.
These markets demonstrate that when players have access to a full licensed product suite — including casino — a majority of value can be retained within the regulated ecosystem.
Betting-only states: structurally capped
The picture changes sharply in states that have legalized sports betting but not online casino.In these jurisdictions, offshore share averages around 74%. Examples illustrate the structural limitation:
- New York, the largest state market by CEB, sees roughly 61% of its value flow offshore.
Ohio shows an even more extreme split, with 82% of market value offshore.
In both cases, the absence of regulated online casinos pushes players seeking slots and table games toward unlicensed platforms. The data indicates that sports betting alone does not meaningfully channelize broader gambling demand.
Time matters
Even within fully regulated states, maturity plays a role. Rhode Island, one of the newest regulated markets, remains below the tipping point, with offshore share exceeding domestic. This suggests that channelization improves over time as licensed brands build product depth, customer trust, and brand equity.
Regulation sets the foundation — but market capture is gradual.
Regulation as a spectrum, not a switch
The U.S. model demonstrates that legalization reduces offshore participation substantially therefore cutting it by more than half in fully regulated environments compared to national averages. However, no U.S. state has fully eliminated offshore activity. For policymakers, the takeaway is pragmatic rather than ideological: full-spectrum regulation meaningfully shifts economic value onshore, but expectations of total elimination are unrealistic.
The debate is therefore no longer whether offshore exists, but how much of it can be practically reduced through comprehensive regulation.
The post Full regulation doesn’t kill offshore but cuts it by more than half, Blask data show appeared first on Americas iGaming & Sports Betting News.
When Africa Gambles: Seasonality Patterns Across Five Markets Revealed by Blask , Nigeria, Tanzania, Kenya, the Democratic Republic of the Congo, and Egypt operate under diverse regulatory regimes and follow different domestic sports calendars — Egypt also observes a Friday–Saturday weekend. Yet, across these markets, gambling activity exhibits a shared rhythm: engagement climbs into Q4 and remains elevated through the year-end, with softer periods either mid-year (Nigeria, Tanzania, Kenya, DR Congo) or late winter (Egypt). Peaks broadly coincide with the European club season, while in some markets domestic leagues run in parallel.
Blask’s Seasonality feature, drawing on data from January 2016 to February 2026, allows mapping engagement by month, day, and hour, revealing nuanced patterns in each market:
Nigeria: The Long Saturday
-
Annual curve accelerates into Q4: October is the top month, followed closely by September, November, and December. June marks the low point, with a modest rebound in July before the late-summer climb.

-
Weekly cycle is weekend-led: Saturday dominates, Sunday and Friday show smaller peaks, weekdays are quieter.
-
Hourly pattern forms a broad plateau on Saturday, with elevated activity from early morning to late evening (5am–9pm Lagos time). Weekday engagement is lower, concentrating in the late afternoon and evening.
Tanzania: Saturday as a Corridor
-
Annual rhythm mirrors Nigeria: softening in June–July, rising from August into a Q4 plateau. Top months are November–December, with October close behind.

-
Weekly cycle hierarchy is clearer: Saturday is strongest, Sunday elevated but lower, Friday leads weekday peaks.
-
Saturday functions as a corridor rather than a sharp spike: activity stays high from 7am–11pm Dar es Salaam time, peaking mid-afternoon to early evening (3pm–7pm). Weekday activity tilts toward evening post-work.
Kenya: Two Clocks in One Market
-
Annual curve rises from August into Q4, with December at the peak, October and November following. Low points in June–July.

-
Weekly peaks favor the weekend: Saturday #1, Sunday #2.
-
Hourly pattern shows dual peaks: a primary late-afternoon to evening spike (3pm–9pm Nairobi time) and a secondary pre-dawn rise (3am–7am), particularly visible on weekends.
DR Congo: The Morning Market
-
January remains unusually strong alongside December, which is the top month.

-
Weekly cycle follows the familiar weekend pattern: Saturday leads, weekend days generally brighter.
-
Hourly peak occurs in the morning, roughly 5am–9am Kinshasa time, shifting an hour later in eastern regions. Weekdays maintain the morning lift, with Saturday adding extra intensity.
Egypt: Friday Leadership and After-Midnight Play
-
Annual curve climbs steadily to year-end: December tops, followed by November and October. Softest periods are February and March.

-
Weekly cycle differs: Friday peaks, Thursday and Saturday slightly behind, reflecting Egypt’s Friday–Saturday weekend.
-
Nighttime engagement is strongest in the group, concentrating after midnight (2am–5am Cairo time), consistently across all days of the week.
The Bigger Picture
-
Q4 is peak season across all five markets. Nigeria peaks earliest (October), while Tanzania, Kenya, DR Congo, and Egypt maintain high engagement through November–December. Four markets soften mid-year, Egypt peaks late winter.
-
Weekend structures explain weekly splits: Saturday for Nigeria, Tanzania, Kenya, DR Congo; Friday for Egypt.
-
Hourly patterns diverge: Nigeria and Tanzania show broad Saturday blocks, Kenya focuses on prime time with pre-dawn tails, DR Congo peaks in the morning, Egypt peaks after midnight. Cross-market scheduling without these insights risks missing most demand.
The post When Africa gambles: seasonality patterns across five countries revealed by Blask appeared first on Eastern European Gaming | Global iGaming & Tech Intelligence Hub.

-

 Booming Games6 days ago
Booming Games releases Ultra Buffalo Hold and Win
-
Baroness Fiona Twycross6 days ago
BGC AGM 2026 Discussed About Surging Illegal Gambling Black Market
-
Big Time Gaming6 days ago
BTG brings iconic board game action to the reels with MONOPOLY MEGAPOTS™
-
Bonus Rush7 days ago
RAW iGaming launches BONUS RUSH® – a new family of feature-focused games
-
Latest News5 days ago
ELA Games Contributes to Discussions on Scalable iGaming Ecosystems and Studio Innovation at HIPTHER Prague Summit
-
Arkansas7 days ago
CATALIST SPORTS SECURES NEW SUPPLIER LICENSES IN ARKANSAS AND NEBRASKA
-
Brazil6 days ago
Brazil advances integrity agenda amid strong market growth
-
Brasil6 days ago
Brasil impulsa su agenda de integridad en un contexto de fuerte crecimiento del mercado