Gambling in the USA
Century Casinos, Inc. Announces Fourth Quarter and Full Year 2019 Results
Century Casinos, Inc. announced its financial results for the three months and year ended December 31, 2019.
Fourth Quarter 2019 Highlights*
- Net operating revenue was $67.2 million, an increase of 49% from the three months ended December 31, 2018.
- Loss from operations was ($14.7) million, a decrease of 846% from the three months ended December 31, 2018.
- Net loss attributable to Century Casinos, Inc. shareholders was ($20.1) million, a decrease of 4080% from the three months ended December 31, 2018.
- Adjusted EBITDA** was $9.8 million, an increase of 69% from the three months ended December 31, 2018.
- Loss per share was ($0.68).
2019 Highlights*
- Net operating revenue was $218.2 million, an increase of 29% from the year ended December 31, 2018.
- Loss from operations was ($5.2) million, a decrease of 155% from the year ended December 31, 2018.
- Net loss attributable to Century Casinos, Inc. shareholders was ($19.2) million, a decrease of 664% from the year ended December 31, 2018.
- Adjusted EBITDA** was $30.3 million, an increase of 30% from the year ended December 31, 2018.
- Basic loss per share was ($0.65), a decrease of 642% from the year ended December 31, 2018.
- Diluted loss per share was ($0.65), a decrease of 691% from the year ended December 31, 2018.
- Book value per share*** at December 31, 2019 was $5.54.
In December 2019, the Company determined that the intangible and tangible assets at Century Casino Bath were impaired. The impairment, which totaled $16.5 million, was determined after evaluating losses incurred by the casino since operations began and future forecasts of continued losses due to the current regulatory environment for casinos in England.
On December 6, 2019, the Company completed its acquisition (the “Acquisition”) of the operations of Isle Casino Cape Girardeau, located in Cape Girardeau, Missouri, Lady Luck Caruthersville, located in Caruthersville, Missouri, and Mountaineer Casino, Racetrack and Resort located in New Cumberland, West Virginia (collectively, the “Acquired Casinos”), from Eldorado Resorts, Inc. for an aggregate purchase price of approximately $110.6 million. Immediately prior to the Acquisition, the real estate assets underlying the Acquired Casinos were sold to an affiliate of VICI Properties Inc. (“VICI PropCo”). On the closing date, the Company and VICI PropCo entered into a triple net lease agreement (the “Master Lease”) for the three Acquired Casino properties. The Master Lease has an initial annual rent of approximately $25.0 million and an initial term of 15 years, with four five-year renewal options.
The consolidated results for the three months and year ended December 31, 2019 and 2018 are as follows:
|
For the three months |
For the year |
|||||||||||||||
|
Amounts in thousands, except per share data |
ended December 31, |
ended December 31, |
||||||||||||||
|
Consolidated Results: |
2019 |
2018 |
% Change |
2019 |
2018 |
% Change |
||||||||||
|
Net Operating Revenue |
$ |
67,236 |
$ |
45,106 |
49% |
$ |
218,227 |
$ |
168,938 |
29% |
||||||
|
(Loss) Earnings from Operations |
(14,745) |
1,976 |
(846%) |
(5,220) |
9,459 |
(155%) |
||||||||||
|
Net (Loss) Earnings Attributable to Century Casinos, Inc. Shareholders |
$ |
(20,140) |
$ |
506 |
(4080%) |
$ |
(19,155) |
$ |
3,394 |
(664%) |
||||||
|
Adjusted EBITDA** |
$ |
9,776 |
$ |
5,801 |
69% |
$ |
30,281 |
$ |
23,377 |
30% |
||||||
|
(Loss) Earnings Per Share Attributable to Century Casinos, Inc. Shareholders: |
||||||||||||||||
|
Basic |
$ |
(0.68) |
$ |
0.02 |
(3500%) |
$ |
(0.65) |
$ |
0.12 |
(642%) |
||||||
|
Diluted |
$ |
(0.68) |
$ |
0.02 |
(3500%) |
$ |
(0.65) |
$ |
0.11 |
(691%) |
||||||
“We are pleased with the fourth quarter results and the immediate impact the addition of the three casinos acquired from Eldorado Resorts had on our operating results,” Erwin Haitzmann and Peter Hoetzinger, Co-Chief Executive Officers of Century Casinos remarked. “The acquired casinos have had very encouraging initial results, and we are excited to continue integrating the operations into the Century brand and to see anticipated meaningful growth from this acquisition on Century Casinos in the future,” Messrs. Haitzmann and Hoetzinger concluded.
The Company is carefully monitoring the situation caused by the coronavirus (COVID-19) pandemic. Although the entire situation is unpredictable, our management teams are prepared to control what they can control. Our casinos are following and implementing the recommendations from the US Centers for Disease Control and Prevention, which include everyday preventative actions to help prevent the spread of respiratory viruses, such as washing your hands often with soap and water, avoiding touching your eyes, nose, and mouth with unwashed hands, covering your cough or sneeze with a tissue, cleaning and disinfecting frequently touched objects and surfaces and of course staying home when you are sick. We are also putting an extra effort into straight-forward and realistic guest messaging and have stepped-up employee trainings to ensure strict compliance with our policies and procedures. We are in constant communication with our employees to reinforce our sanitation safety procedures in both guest-facing and back-of-house areas. We are sanitizing high-traffic public areas at an increased frequency. Proper procedures are posted in all back-of-house work areas.
To date, COVID-19 has not had a significant impact on our US or Canadian markets, while the market in Poland has been weakening by approximately ten percent. Our customer base is very diversified within North America. Our casinos are ‘local’ casinos in urban and suburban locations, with the vast majority of our business from customers who live within an hour from our facilities. Our casinos have negligible meeting and convention business and few of our customers travel by air to visit us. This may temper the impact of COVID-19 on our business, but this situation continues to evolve and could adversely impact us until the virus runs its course.
Reportable Segment Results*
The table below shows the Company’s operating segments that are included in each of the Company’s reportable segments as of December 31, 2019:
|
Reportable Segment |
Operating Segment |
Reporting Unit |
|
United States |
Colorado |
Century Casino & Hotel – Central City |
|
Century Casino & Hotel – Cripple Creek |
||
|
West Virginia |
Mountaineer Casino, Racetrack & Resort |
|
|
Missouri |
Century Casino Cape Girardeau |
|
|
Century Casino Caruthersville |
||
|
Canada |
Edmonton |
Century Casino & Hotel – Edmonton |
|
Century Casino St. Albert |
||
|
Century Mile Racetrack and Casino |
||
|
Calgary |
Century Casino Calgary |
|
|
Century Downs Racetrack and Casino |
||
|
Century Bets! Inc. |
||
|
Poland |
Poland |
Casinos Poland |
|
Corporate and Other |
Corporate and Other |
Cruise Ships & Other |
|
Century Casino Bath |
||
|
Corporate Other |
The Company’s net operating revenue increased by $22.1 million, or 49%, and by $49.3 million, or 29%, for the three months and year ended December 31, 2019, compared to the three months and year ended December 31, 2018. Following is a summary of the changes in net operating revenue by reportable segment for the three months and year ended December 31, 2019, compared to the three months and year ended December 31, 2018:
|
Net Operating Revenue |
||||||||||||||||||||||
|
For the three months |
For the year |
|||||||||||||||||||||
|
ended December 31, |
ended December 31, |
|||||||||||||||||||||
|
Amounts in thousands |
2019 |
2018 |
$ Change |
% Change |
2019 |
2018 |
$ Change |
% Change |
||||||||||||||
|
United States |
$ |
23,926 |
$ |
7,938 |
$ |
15,988 |
201% |
$ |
49,998 |
$ |
33,483 |
$ |
16,515 |
49% |
||||||||
|
Canada |
20,291 |
15,678 |
4,613 |
29% |
80,650 |
61,361 |
19,289 |
31% |
||||||||||||||
|
Poland |
21,675 |
19,514 |
2,161 |
11% |
81,894 |
68,209 |
13,685 |
20% |
||||||||||||||
|
Corporate and Other |
1,344 |
1,976 |
(632) |
(32%) |
5,685 |
5,885 |
(200) |
(3%) |
||||||||||||||
|
Consolidated |
$ |
67,236 |
$ |
45,106 |
$ |
22,130 |
49% |
$ |
218,227 |
$ |
168,938 |
$ |
49,289 |
29% |
||||||||
The Company’s earnings from operations decreased by ($16.7) million, or (846%), and by ($14.7) million, or (155%), for the three months and year ended December 31, 2019, compared to the three months and year ended December 31, 2018. Following is a summary of the changes in earnings (loss) from operations by reportable segment for the three months and year ended December 31, 2019, compared to the three months and year ended December 31, 2018:
|
Earnings (Loss) from Operations |
||||||||||||||||||||||
|
For the three months |
For the year |
|||||||||||||||||||||
|
ended December 31, |
ended December 31, |
|||||||||||||||||||||
|
Amounts in thousands |
2019 |
2018 |
$ Change |
% Change |
2019 |
2018 |
$ Change |
% Change |
||||||||||||||
|
United States |
$ |
4,685 |
$ |
1,033 |
$ |
3,652 |
354% |
$ |
9,478 |
$ |
5,882 |
$ |
3,596 |
61% |
||||||||
|
Canada |
4,000 |
3,675 |
325 |
9% |
16,115 |
14,633 |
1,482 |
10% |
||||||||||||||
|
Poland |
1,627 |
460 |
1,167 |
254% |
5,915 |
145 |
5,770 |
3979% |
||||||||||||||
|
Corporate and Other |
(25,057) |
(3,192) |
(21,865) |
(685%) |
(36,728) |
(11,201) |
(25,527) |
(228%) |
||||||||||||||
|
Consolidated |
$ |
(14,745) |
$ |
1,976 |
$ |
(16,721) |
(846%) |
$ |
(5,220) |
$ |
9,459 |
$ |
(14,679) |
(155%) |
||||||||
Net earnings attributable to Century Casinos, Inc. shareholders decreased by ($20.6) million, or (4080%), and by ($22.5) million, or (664%), for the three months and year ended December 31, 2019, compared to the three months and year ended December 31, 2018. Following is a summary of the changes in net earnings (loss) attributable to Century Casinos, Inc. shareholders by reportable segment for the three months and year ended December 31, 2019, compared to the three months and year ended December 31, 2018:
|
Net Earnings (Loss) Attributable to Century Casinos, Inc. Shareholders |
||||||||||||||||||||||
|
For the three months |
For the year |
|||||||||||||||||||||
|
ended December 31, |
ended December 31, |
|||||||||||||||||||||
|
Amounts in thousands |
2019 |
2018 |
$ Change |
% Change |
2019 |
2018 |
$ Change |
% Change |
||||||||||||||
|
United States |
$ |
2,261 |
$ |
767 |
$ |
1,494 |
195% |
$ |
5,825 |
$ |
4,373 |
$ |
1,452 |
33% |
||||||||
|
Canada |
948 |
2,077 |
(1,129) |
(54%) |
6,669 |
7,715 |
(1,046) |
(14%) |
||||||||||||||
|
Poland |
1,352 |
179 |
1,173 |
655% |
3,466 |
(153) |
3,619 |
2365% |
||||||||||||||
|
Corporate and Other |
(24,701) |
(2,517) |
(22,184) |
(881%) |
(35,115) |
(8,541) |
(26,574) |
(311%) |
||||||||||||||
|
Consolidated |
$ |
(20,140) |
$ |
506 |
$ |
(20,646) |
(4080%) |
$ |
(19,155) |
$ |
3,394 |
$ |
(22,549) |
(664%) |
||||||||
Items deducted from or added to earnings from operations to arrive at net earnings (loss) attributable to Century Casinos, Inc. shareholders include interest income, interest expense, gains (losses) on foreign currency transactions and other, income tax expense and non-controlling interests.
The Company’s Adjusted EBITDA** increased by $4.0 million, or 69%, and by $6.9 million, or 30%, for the three months and year ended December 31, 2019 compared to the three months and year ended December 31, 2018. Following is a summary of the changes in Adjusted EBITDA** by reportable segment for the three months and year ended December 31, 2019 compared to the three months and year ended December 31, 2018:
|
Adjusted EBITDA** |
||||||||||||||||||||||
|
For the three months |
For the year |
|||||||||||||||||||||
|
ended December 31, |
ended December 31, |
|||||||||||||||||||||
|
Amounts in thousands |
2019 |
2018 |
$ Change |
% Change |
2019 |
2018 |
$ Change |
% Change |
||||||||||||||
|
United States |
$ |
5,441 |
$ |
1,582 |
$ |
3,859 |
244% |
$ |
11,825 |
$ |
8,061 |
$ |
3,764 |
47% |
||||||||
|
Canada |
5,378 |
4,991 |
387 |
8% |
21,212 |
19,522 |
1,690 |
9% |
||||||||||||||
|
Poland |
2,484 |
1,733 |
751 |
43% |
9,392 |
4,890 |
4,502 |
92% |
||||||||||||||
|
Corporate and Other |
(3,527) |
(2,505) |
(1,022) |
(41%) |
(12,148) |
(9,096) |
(3,052) |
(34%) |
||||||||||||||
|
Consolidated |
$ |
9,776 |
$ |
5,801 |
$ |
3,975 |
69% |
$ |
30,281 |
$ |
23,377 |
$ |
6,904 |
30% |
||||||||
Balance Sheet and Liquidity
As of December 31, 2019, the Company had $54.8 million in cash and cash equivalents and $179.0 million in outstanding debt on its balance sheet compared to $45.6 million in cash and cash equivalents and $59.5 million in outstanding debt at December 31, 2018. The outstanding debt as of December 31, 2019 included the following: $170.0 million related to the Company’s credit agreement with a group of lenders led by Macquarie Capital that the Company entered into in December 2019 in connection with the Acquisition, replacing the Company’s credit agreement with the Bank of Montreal; $2.0 million of bank debt related to Casinos Poland; $2.0 million of bank debt related to Century Casino Bath; and $15.0 million related to a long-term land lease for CDR, net of $10.0 million in deferred financing costs.
Conference Call Information
Today the Company will post a copy of its Annual Report on Form 10-K filed with the SEC for the year ended December 31, 2019 on its website at www.cnty.com/investor/financials/sec-filings. The Company will also post a presentation on the year end results on its website at www.cnty.com/investor/presentations.
The Company will host its fourth quarter 2019 earnings conference call today, Friday, March 13th, at 8:00 am MDT. U.S. domestic participants should dial 1-844-244-9160. For all international participants, please use 330-931-4670 to dial-in. Participants may listen to the call live at www.centurycasinos.adobeconnect.com/earningsrelease or obtain a recording of the call on the Company’s website until March 31, 2020 at www.cnty.com/investor/financials/sec-filings.
|
CENTURY CASINOS, INC. AND SUBSIDIARIES |
||||||||||||
|
Condensed Consolidated Statements of (Loss) Earnings |
||||||||||||
|
For the three months |
For the year |
|||||||||||
|
ended December 31, |
ended December 31, |
|||||||||||
|
Amounts in thousands, except for per share information |
2019 |
2018 |
2019 |
2018 |
||||||||
|
Operating revenue: |
||||||||||||
|
Net operating revenue |
$ |
67,236 |
$ |
45,106 |
$ |
218,227 |
$ |
168,938 |
||||
|
Operating costs and expenses: |
||||||||||||
|
Total operating costs and expenses |
81,981 |
43,152 |
223,446 |
159,502 |
||||||||
|
Earnings (loss) from equity investment |
— |
22 |
(1) |
23 |
||||||||
|
(Loss) earnings from operations |
(14,745) |
1,976 |
(5,220) |
9,459 |
||||||||
|
Non-operating income (expense), net |
(3,569) |
(1,053) |
(6,747) |
(3,536) |
||||||||
|
(Loss) earnings before income taxes |
(18,314) |
923 |
(11,967) |
5,923 |
||||||||
|
Income tax provision |
(955) |
(133) |
(4,174) |
(1,917) |
||||||||
|
Net (loss) earnings |
(19,269) |
790 |
(16,141) |
4,006 |
||||||||
|
Net earnings attributable to non-controlling interests |
(871) |
(284) |
(3,014) |
(612) |
||||||||
|
Net (loss) earnings attributable to Century Casinos, Inc. shareholders |
$ |
(20,140) |
$ |
506 |
$ |
(19,155) |
$ |
3,394 |
||||
|
(Loss) earnings per share attributable to Century Casinos, Inc. shareholders: |
||||||||||||
|
Basic |
$ |
(0.68) |
$ |
0.02 |
$ |
(0.65) |
$ |
0.10 |
||||
|
Diluted |
$ |
(0.68) |
$ |
0.02 |
$ |
(0.65) |
$ |
0.10 |
||||
|
Weighted average common shares |
||||||||||||
|
Basic |
29,474 |
29,439 |
29,452 |
29,401 |
||||||||
|
Diluted |
29,474 |
29,861 |
29,452 |
29,962 |
||||||||
|
CENTURY CASINOS, INC. AND SUBSIDIARIES |
||||||
|
Condensed Consolidated Balance Sheets |
||||||
|
December 31, |
December 31, |
|||||
|
Amounts in thousands |
2019 |
2018 |
||||
|
Assets |
||||||
|
Current assets |
$ |
79,366 |
$ |
54,974 |
||
|
Property and equipment, net |
503,933 |
187,017 |
||||
|
Other assets |
143,601 |
36,834 |
||||
|
Total assets |
$ |
726,900 |
$ |
278,825 |
||
|
Liabilities and Equity |
||||||
|
Current liabilities |
$ |
56,570 |
$ |
50,020 |
||
|
Non-current liabilities |
498,255 |
45,422 |
||||
|
Century Casinos, Inc. shareholders’ equity |
163,306 |
176,321 |
||||
|
Non-controlling interests |
8,769 |
7,062 |
||||
|
Total liabilities and equity |
$ |
726,900 |
$ |
278,825 |
||
|
CENTURY CASINOS, INC. AND SUBSIDIARIES |
||||||||||||||||
|
Constant Currency* Results (unaudited) |
||||||||||||||||
|
For the three months |
For the year |
|||||||||||||||
|
ended December 31, |
ended December 31, |
|||||||||||||||
|
Amounts in thousands |
2019 |
2018 |
% Change |
2019 |
2018 |
% Change |
||||||||||
|
Net operating revenue as reported (GAAP) |
$ |
67,236 |
$ |
45,106 |
49% |
$ |
218,227 |
$ |
168,938 |
29% |
||||||
|
Foreign currency impact vs. 2018 |
559 |
7,207 |
||||||||||||||
|
Net operating revenue constant currency (non-GAAP)* |
$ |
67,795 |
$ |
45,106 |
50% |
$ |
225,434 |
$ |
168,938 |
33% |
||||||
|
(Loss) earnings from operations (GAAP) |
$ |
(14,745) |
$ |
1,976 |
(846%) |
$ |
(5,220) |
$ |
9,459 |
(155%) |
||||||
|
Foreign currency impact vs. 2018 |
934 |
955 |
||||||||||||||
|
(Loss) earnings from operations constant currency (non-GAAP)* |
$ |
(13,811) |
$ |
1,976 |
(799%) |
$ |
(4,265) |
$ |
9,459 |
(145%) |
||||||
|
Net (loss) earnings attributable to Century Casinos, Inc. shareholders as reported (GAAP) |
$ |
(20,140) |
$ |
506 |
(4080%) |
$ |
(19,155) |
$ |
3,394 |
(664%) |
||||||
|
Foreign currency impact vs. 2018 |
339 |
(40) |
||||||||||||||
|
Net (loss) earnings attributable to Century Casinos, Inc. shareholders constant currency (non-GAAP)* |
$ |
(19,801) |
$ |
506 |
(4013%) |
$ |
(19,195) |
$ |
3,394 |
(666%) |
||||||
Gains and losses on foreign currency transactions are added back to net (loss) earnings in the Company’s Adjusted EBITDA** calculations. As such, there is no foreign currency impact to Adjusted EBITDA** when calculating Constant Currency* results.
|
Adjusted EBITDA Margins *** (unaudited) |
||||
|
For the three months |
For the year |
|||
|
ended December 31, |
ended December 31, |
|||
|
2019 |
2018 |
2019 |
2018 |
|
|
United States |
23% |
20% |
24% |
24% |
|
Canada |
27% |
32% |
26% |
32% |
|
Poland |
11% |
9% |
11% |
7% |
|
Corporate and Other |
(262%) |
(127%) |
(214%) |
(155%) |
|
Consolidated Adjusted EBITDA Margin |
15% |
13% |
14% |
14% |
|
CENTURY CASINOS, INC. AND SUBSIDIARIES |
|||||||||||||||
|
Reconciliation of Adjusted EBITDA ** to Net Earnings (Loss) Attributable to Century Casinos, Inc. Shareholders by Reportable Segment. |
|||||||||||||||
|
For the three months ended December 31, 2019 |
|||||||||||||||
|
Amounts in thousands |
United |
Canada |
Poland |
Corporate |
Total |
||||||||||
|
Net earnings (loss) attributable to Century Casinos, Inc. shareholders |
$ |
2,261 |
$ |
948 |
$ |
1,352 |
$ |
(24,701) |
$ |
(20,140) |
|||||
|
Interest expense (income), net |
1,635 |
1,456 |
55 |
1,020 |
4,166 |
||||||||||
|
Income taxes (benefit) |
789 |
1,375 |
222 |
(1,431) |
955 |
||||||||||
|
Depreciation and amortization |
756 |
1,356 |
781 |
254 |
3,147 |
||||||||||
|
Net earnings attributable to non-controlling interests |
— |
195 |
676 |
— |
871 |
||||||||||
|
Non-cash stock-based compensation |
— |
— |
— |
324 |
324 |
||||||||||
|
Loss (gain) on foreign currency transactions, cost recovery income and other |
— |
26 |
(678) |
16,704 |
16,052 |
||||||||||
|
Loss on disposition of fixed assets |
— |
22 |
76 |
1 |
99 |
||||||||||
|
Acquisition costs |
— |
— |
— |
4,302 |
4,302 |
||||||||||
|
Adjusted EBITDA |
$ |
5,441 |
$ |
5,378 |
$ |
2,484 |
$ |
(3,527) |
$ |
9,776 |
|||||
|
For the three months ended December 31, 2018 |
|||||||||||||||
|
Amounts in thousands |
United |
Canada |
Poland |
Corporate |
Total |
||||||||||
|
Net earnings (loss) attributable to Century Casinos, Inc. shareholders |
$ |
767 |
$ |
2,077 |
$ |
179 |
$ |
(2,517) |
$ |
506 |
|||||
|
Interest expense (income), net |
— |
1,084 |
50 |
65 |
1,199 |
||||||||||
|
Income taxes (benefit) |
266 |
435 |
280 |
(848) |
133 |
||||||||||
|
Depreciation and amortization |
548 |
779 |
1,025 |
402 |
2,754 |
||||||||||
|
Net earnings attributable to non-controlling interests |
— |
174 |
89 |
21 |
284 |
||||||||||
|
Non-cash stock-based compensation |
— |
— |
— |
255 |
255 |
||||||||||
|
(Gain) loss on foreign currency transactions and cost recovery income |
— |
(95) |
(138) |
94 |
(139) |
||||||||||
|
Loss on disposition of fixed assets |
1 |
4 |
27 |
23 |
55 |
||||||||||
|
Pre-opening expenses |
— |
533 |
221 |
— |
754 |
||||||||||
|
Adjusted EBITDA |
$ |
1,582 |
$ |
4,991 |
$ |
1,733 |
$ |
(2,505) |
$ |
5,801 |
|||||
|
CENTURY CASINOS, INC. AND SUBSIDIARIES |
|||||||||||||||
|
Reconciliation of Adjusted EBITDA ** to Net Earnings (Loss) Attributable to Century Casinos, Inc. Shareholders by Reportable Segment. |
|||||||||||||||
|
For the Year ended December 31, 2019 |
|||||||||||||||
|
Amounts in thousands |
United |
Canada |
Poland |
Corporate |
Total |
||||||||||
|
Net earnings (loss) attributable to Century Casinos, Inc. shareholders |
$ |
5,825 |
$ |
6,669 |
$ |
3,466 |
$ |
(35,115) |
$ |
(19,155) |
|||||
|
Interest expense (income), net |
1,635 |
5,312 |
197 |
1,085 |
8,229 |
||||||||||
|
Income taxes (benefit) |
2,018 |
3,278 |
1,617 |
(2,739) |
4,174 |
||||||||||
|
Depreciation and amortization |
2,330 |
4,539 |
3,064 |
910 |
10,843 |
||||||||||
|
Net earnings (loss) attributable to non-controlling interests |
— |
1,295 |
1,731 |
(12) |
3,014 |
||||||||||
|
Non-cash stock-based compensation |
— |
— |
— |
1,303 |
1,303 |
||||||||||
|
(Gain) loss on foreign currency transactions, cost recovery income and other |
— |
(439) |
(1,096) |
16,709 |
15,174 |
||||||||||
|
Loss on disposition of fixed assets |
17 |
20 |
413 |
345 |
795 |
||||||||||
|
Acquisition costs |
— |
— |
— |
5,366 |
5,366 |
||||||||||
|
Pre-opening expenses |
— |
538 |
— |
— |
538 |
||||||||||
|
Adjusted EBITDA |
$ |
11,825 |
$ |
21,212 |
$ |
9,392 |
$ |
(12,148) |
$ |
30,281 |
|||||
|
For the Year ended December 31, 2018 |
|||||||||||||||
|
Amounts in thousands |
United |
Canada |
Poland |
Corporate |
Total |
||||||||||
|
Net earnings (loss) attributable to Century Casinos, Inc. shareholders |
$ |
4,373 |
$ |
7,715 |
$ |
(153) |
$ |
(8,541) |
$ |
3,394 |
|||||
|
Interest expense (income), net |
1 |
3,895 |
206 |
12 |
4,114 |
||||||||||
|
Income taxes (benefit) |
1,508 |
2,536 |
595 |
(2,722) |
1,917 |
||||||||||
|
Depreciation and amortization |
2,178 |
3,211 |
3,065 |
945 |
9,399 |
||||||||||
|
Net earnings (loss) attributable to non-controlling interests |
— |
722 |
(75) |
(35) |
612 |
||||||||||
|
Non-cash stock-based compensation |
— |
— |
— |
868 |
868 |
||||||||||
|
(Gain) loss on foreign currency transactions and cost recovery income |
— |
(235) |
(428) |
2 |
(661) |
||||||||||
|
Loss on disposition of fixed assets |
1 |
10 |
1,054 |
25 |
1,090 |
||||||||||
|
Pre-opening expenses |
— |
1,668 |
626 |
350 |
2,644 |
||||||||||
|
Adjusted EBITDA |
$ |
8,061 |
$ |
19,522 |
$ |
4,890 |
$ |
(9,096) |
$ |
23,377 |
|||||
CENTURY CASINOS, INC. AND SUBSIDIARIES
SUPPLEMENTAL INFORMATION
* The impact of foreign exchange rates is highly variable and difficult to predict. The Company uses a Constant Currency basis to show the impact from foreign exchange rates on current period financial information compared to prior period financial information using the prior period’s foreign exchange rates. In order to properly understand the underlying business trends and performance of the Company’s ongoing operations, management believes that investors may find it useful to consider the impact of excluding changes in foreign exchange rates from the Company’s net operating revenue, (loss) earnings from operations and net earnings (loss) attributable to Century Casinos, Inc. shareholders. Constant currency results are calculated by dividing the current quarter or year to date local currency segment results, excluding the local currency impact of foreign currency gains and losses, by the prior year’s average exchange rate for the quarter or year to date and comparing them to actual U.S. dollar results for the prior quarter or year to date. The average exchange rates for the current and prior year are reported in Note 2 to the Consolidated Financial Statements included in Part II, Item 8, “Financial Statements and Supplementary Data” of the Company’s Annual Report on Form 10-K. The average exchange rates for the three months ended December 31, 2019 and 2018 are presented below.
|
For the three months |
||||||
|
ended December 31, |
||||||
|
Average Rates |
2019 |
2018 |
% Change |
|||
|
Canadian dollar (CAD) |
1.3199 |
1.3218 |
0.1% |
|||
|
Euros (EUR) |
0.9032 |
0.8763 |
(3.1%) |
|||
|
Polish zloty (PLN) |
3.8702 |
3.7668 |
(2.7%) |
|||
|
British pound (GBP) |
0.7766 |
0.7773 |
0.1% |
|||
|
Source: Pacific Exchange Rate Service |
||||||
Constant currency information is not a measure of financial performance under generally accepted accounting principles in the United States of America (GAAP) and should not be considered a substitute for net operating revenue, (loss) earnings from operations or net earnings (loss) attributable to Century Casinos, Inc. shareholders as determined in accordance with GAAP.
SOURCE Century Casinos, Inc.


Gambling in the USA
Wind Creek Hospitality Celebrates “Winner Takes All” Champion After $1 Million Win, Chance at Up to $11.8 Million

Wind Creek Hospitality has announced the winner of its cross-property “Winner Takes All” casino promotion, which culminated in a championship event held at Wind Creek Chicago Southland. The event brought together finalists from across Wind Creek’s portfolio for a high-stakes grand prize championship competition and VIP Guest experience.
Finalists qualified through slot tournaments at their home properties and advanced through quarterfinal and semifinal rounds before earning their place in the final championship event in Chicago. The finale featured a series of timed slot tournaments held on June 13, progressively narrowing the field of competitors through elimination rounds until the final winner was determined.
At the conclusion of the tournament on June 13, Aaron Nelson from Wind Creek Atmore was crowned the winner of the “Winner Takes All” competition, claiming a $1,000,000 prize in the tournament’s final round, and earning the opportunity to compete for the promotion’s ultimate grand prize of up to $11,888,888. “Winner Takes All” finalists were also awarded more than $200,000 in cash and prizes in the finale tournament, including a $100,000 second-place prize followed up by a drawing with a $50,000 prize pool, including a $25,000 top prize and multiple $1000 prize winners.
In addition to the competition, finalists participated in curated Wind Creek Rewards experiences designed to highlight Chicago’s cultural and hospitality offerings. Experiences included a Chicago River architectural boat cruise and a guided Chinatown culinary tasting tour, alongside a welcome reception featuring food and beverage service. Travel and accommodations were provided by Wind Creek Hospitality as part of the finalist experience.
The “Winner Takes All” promotion marked one of Wind Creek Hospitality’s most expansive cross-property tournament experiences, combining competitive gaming with destination-based Guest programming and elevated hospitality.
The post Wind Creek Hospitality Celebrates “Winner Takes All” Champion After $1 Million Win, Chance at Up to $11.8 Million appeared first on Americas iGaming & Sports Betting News.

Limited-run “Super By Superbet” launch includes the “Camisa Cafu,” with 150 numbered and signed units referencing his 150 Brazil caps.
Superbet honored former Brazil captain Cafu on Monday (15) with a campaign displayed on a Times Square billboard in New York City. The company said the activation promoted its “Super By Superbet” exclusive collection created for the 2026 edition, which includes a special piece dedicated to the player.
According to the company, Cafu attended the display in person, drawing a crowd of fans seeking photos and chanting his name in one of the city’s busiest tourist areas.
“The shirt is wonderful. I feel very happy for all the incredible moments I’ve experienced here. I receive so much affection everywhere I go. Receiving recognition while still alive is one of the best things in the world.”.
“It’s an inexplicable energy to feel the love of the Brazilian people for me, right there in Times Square. Only we Brazilians know what that means.”
The centerpiece of the launch, which Superbet said totals 3,000 pieces, is the “Camisa Cafu.” The item is a limited run of 150 numbered and autographed units, which the company said references Cafu’s 150 matches for the Brazilian national team, and includes the inscription “Jardim Irene,” highlighting the player’s roots.
The post Superbet honors Cafu with Times Square campaign for 2026 collection appeared first on Americas iGaming & Sports Betting News.
Choctaw Casino & Resort
Oklahoma Man Wins $1 Million in Choctaw Casino & Resort – Durant’s first “3 Months. 3 Millionaires.” Drawing of 2026
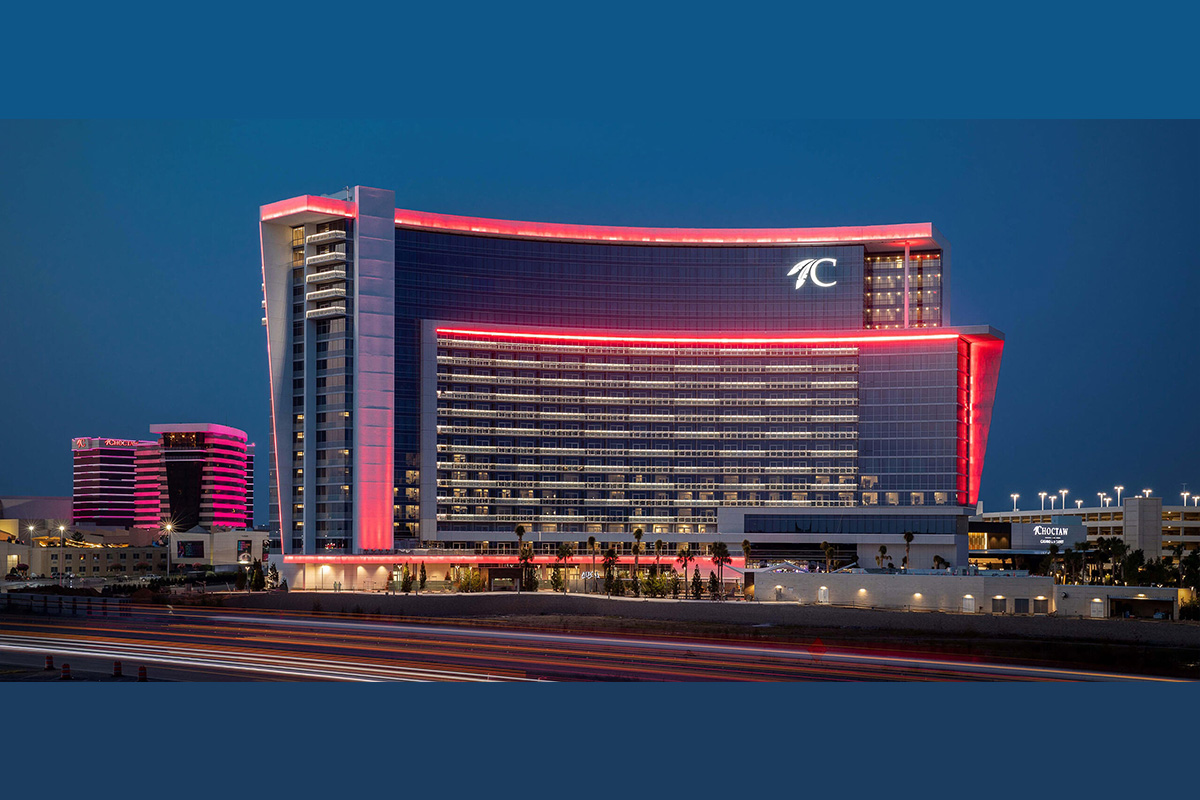
Choctaw Casino & Resort – Durant announced its first millionaire of the summer late Saturday evening as part of the 2026 edition of “3 Months. 3 Millionaires.” Douglas C. from Norman, Oklahoma, became the First of three lucky Choctaw Rewards Club members to become an instant millionaire this summer.
Douglas who was very surprised to hear his name, said he plans to give a portion of his winnings to a few charities.
“I don’t feel any different. Being a millionaire is a state of mind and how you deal with folks and what you do to make this world a better place,” he said.
Choctaw Casino & Resort – Durant is also taking the excitement of “3 Months. 3 Millionaires.” to the winner’s hometown and will make a $10,000 donation to a local 501(c)(3) nonprofit organization of the winner’s choice.
In addition to crowning a new millionaire, Choctaw Casino & Resort – Durant also held its first-ever bonus drawing for $250,000, where Eden H. from Richardson, Texas, was the winner. This new addition will take place on each million-dollar drawing day, one hour after the grand-prize drawing.
“We are thrilled to announce our first millionaire of the summer. By the end of this summer, Choctaw Casino & Resort – Durant will have made 12 Choctaw Rewards Club members millionaires through this promotion. This truly is where millionaires are made. This is an incredible, life-changing opportunity for our rewards club members, and we’re thrilled to be able to provide it. We look forward to continuing to innovate ways to create exciting opportunities for guests to win here at Choctaw,” said Jeff Penz, senior director of gaming and hospitality for Choctaw Casino & Resort – Durant.
The next $1 million drawing will be held on Saturday, July 11, and the winner must be present to claim their prize.
The post Oklahoma Man Wins $1 Million in Choctaw Casino & Resort – Durant’s first “3 Months. 3 Millionaires.” Drawing of 2026 appeared first on Americas iGaming & Sports Betting News.

-

 Australia5 days ago
Former Star Entertainment Executives Mathias Bekier and Paula Martin Disqualified and Ordered to Pay Penalties
-
CFTC6 days ago
Novig Secures CFTC Designation, Bringing the First Prediction Market Built for Sports Fans Nationwide
-
LatAm6 days ago
Innovative payment solutions provider teams up with leading LATAM fintech platform to expand digital wallet access for online betting customers in Mexico
-
Alberta6 days ago
MediaTroopers lines up eight operator partners ahead of Alberta launch
-
Alberta6 days ago
Why Alberta Represents the Next Major Growth Opportunity for Gaming Operators
-
Alina Mihaela Popa Chief Commercial Officer at ICONIC216 days ago
ICONIC21 launches live casino and RNG titles with Maxbet in Romania
-
Aviator Studio7 days ago
Aviator Studio Secures Significant Legal Victory in Brazil as Federal Court Suspends Spribe’s Aviator Trademark Rights
-
ATG6 days ago
ATG Casino player in Sweden wins €2m jackpot powered by EveryMatrix