Latest News
Optimove Insight Analysis of NFL 2025-2026 Planned v. Actual NFL Wagering Intentions Through the Wild Card Round
This analysis compares what NFL bettors said they planned to bet before the 2025–26 season with what they actually did through the end of the Wild Card round, using observed behavior from nearly 4.0 million bettors alongside a pre-season survey of 425 bettors. The results show that while high-level intentions broadly align with reality, bettors consistently overestimate how often, how live, and how much they will bet, especially once the season is underway.
The regular season remains the backbone of NFL betting. Both stated intent and actual behavior confirm that most wagering activity is anchored there, accounting for roughly three-quarters of all bets. However, interest in fringe periods is overstated. Pre-season betting and Wild Card betting both sound appealing in theory, but actual participation is far lower than expected. In particular, nearly half of the surveyed bettors anticipated betting during the Wild Card, yet real activity through that round is closer to one-sixth of bettors, underscoring that playoff “excitement” does not automatically translate into betting volume when the window is short.
Live betting is consistently over-promised and under-delivered. While bettors express strong interest in live wagering before the season, actual behavior skews heavily toward pre-game bets. That said, many bettors blend behaviors in practice, moving between pre-game and live depending on context. This suggests opportunity lies less in converting bettors to “live-only” and more in designing experiences that fluidly support both.
Bet structure shows the strongest alignment between intent and reality. Multi-leg bets, particularly parlays, dominate both planned and actual behavior. This confirms that bettors’ appetite for higher-engagement, multi-outcome tickets is real and durable. As the playoff slate narrows, this preference is likely to shift toward same-game parlays rather than traditional multi-game builds.
The largest disconnect appears in stake size. Bettors systematically overestimate how much they expect to wager. In reality, small bets placed frequently dominate observed behavior, with low-stake wagers far more common than survey responses suggest. While $11–$50 emerges as the true “default” stake band, higher stakes are significantly rarer in practice than bettors predict before the season.
Looking ahead, intensity, not volume, is likely to define the later playoff rounds. As the number of games shrinks, total betting volume may not rival the regular season, but engagement among remaining bettors typically deepens. This often manifests as more bets per game, greater use of live betting moments, and heavier reliance on parlays rather than larger single-ticket stakes.
Bottom line:
NFL bettors are directionally honest about how they want to bet, but consistently optimistic about how much and how often they will do so. For operators, the opportunity lies in recognizing where intent reliably converts (regular season, parlays, pre-game betting) and where friction emerges (live betting adoption, playoff participation, higher stakes). Designing experiences that emphasize intensity, flexibility, and frequent low-stake engagement is likely to outperform strategies built on assumed playoff spikes or inflated stake expectations.
Detailed Results:
This report compares the following:
- Actual Bets of 3,991,737 NFL bettors covering the 2025/26 NFL season through the end of the Wild Card round; and
- Planned Bets of 425 NFL Bettors surveyed before the start of the season.
Regular Season, As Expected – Wild Card, Not So Much
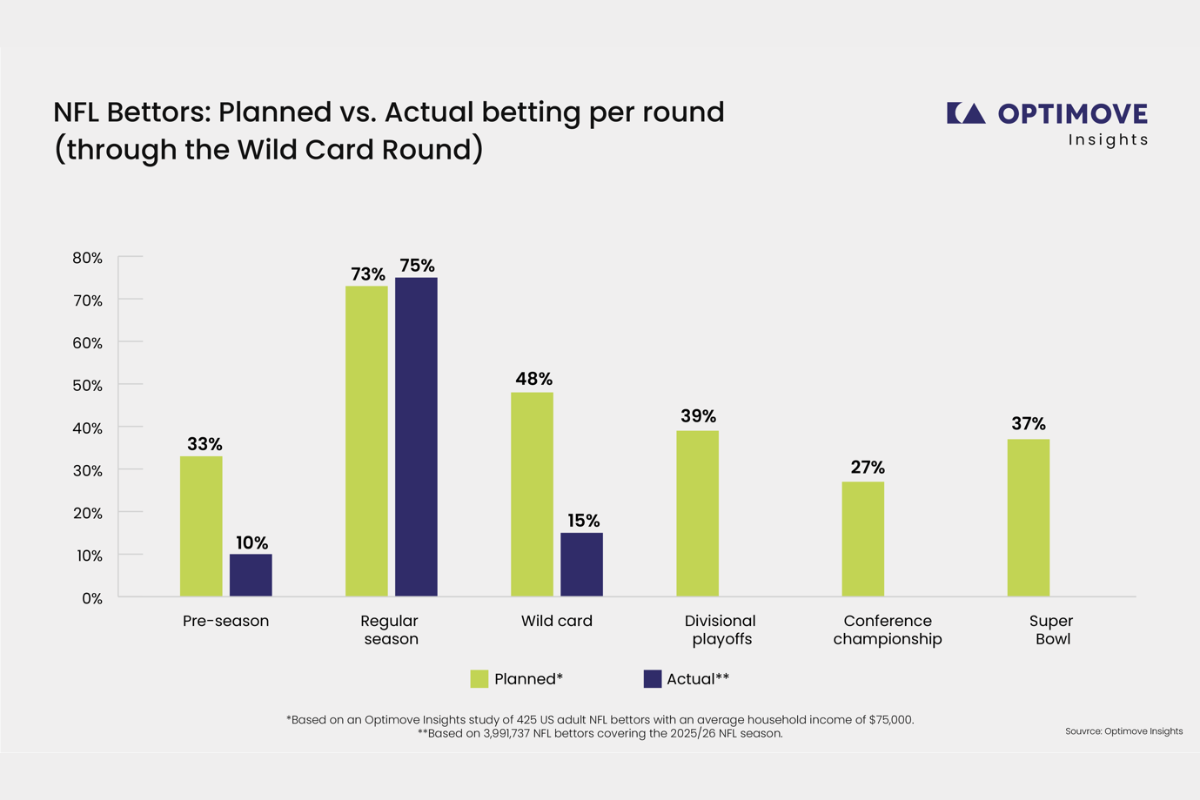
This chart compares what NFL bettors said they were most likely to bet on (planned bets) versus bets in the 2025/26 season (actual betting behavior) through the end of the Wild Card round.
A few things jump out immediately:
- The regular season is the clear anchor in both datasets. Survey respondents before the start of the season overwhelmingly pointed to the regular season as their primary betting period (73%), and real behavior supports that, as (75%) of observed betting activity happened during the regular season.
- Pre-season betting is meaningfully lower in reality than in stated intent. While 33% of survey respondents said they’d be likely to bet in the pre-season, real activity through our benchmark is closer to ~10%. Bottom line: pre-season sounds appealing in theory, but far fewer people follow through once games start.
- Wild Card interest is overestimated in the survey before the season. The survey suggests nearly half of bettors (48%) expected to bet during Wild Card, but real behavior in our data is much lower (~15%). That gap is a big signal that “high-stakes playoff excitement” doesn’t automatically translate to volume, especially when the round is short and concentrated.
What we’d expect to see next:
- Because this analysis only includes activity through Wild Card, the later playoff rounds are reported the survey before the NFL season start.
Based on how betting typically behaves as stakes rise, we expect a concentration effect – Fewer days, bigger moments: The Divisional Round, Conference Championships, and Super Bowl have fewer games, so raw volume may not match the regular season but attention is higher, which often shows up as more bets per game, higher average stake, and heavier live-betting mix.
- A “late-stage spike” among engaged bettors: Even if overall volume stays lower than the regular season, the bettors who remain active tend to be more committed, which can make the later rounds disproportionately valuable from a revenue and engagement perspective.
If the regular season is where breadth happens, the next rounds are where intensity can show up.
Bettors Say They Want Make Live Bets; But Primarily Bet Pre-Game
This chart compares stated preference (survey before the season start) with observed behavior across three types of bets: 1) pre-game, 2) live, and 3) both.
Here’s what stands out:
- Pre-game betting is executed as planned. Nearly half of respondents said they typically prefer pre-game (48%), and real behavior comes in slightly higher at 50%. That’s a strong alignment between intent and reality. Pre-game betting remains the default mode for most bettors.
- Live betting is the biggest gap between planned and actual betting. In the survey, 31% said they planned live betting, but in practice only 17% did.
- “Both” is under claimed but over delivered. Only 21% said they have no preference and do both (pre-game and live), yet actual behavior suggests 33% of bettors mix pre-game and live. So even if bettors identify with one style, many still shift modes depending on context.
What we’d expect to see next:
- As the NFL season progresses, this mix between live and pre-game betting can change: Later playoff rounds tend to be more “appointment viewing,” which can naturally lift live betting, especially in close games and high-profile matchups.
- Even if the share of “live only” bettors remain modest, we’d expect live engagement to deepen as games become must watch events.
Intent Matches Reality: Multi Bets Lead the Way
Next, we analyzed how bettors build their tickets: single bets versus multi-leg parlays, comparing survey intent with actual behavior through the end of the Wild Card round.
Unlike other comparisons, this shows minimal gap between what bettors said and what they actually did:
- Multi bets (parlays) dominate in both views. The survey shows 72% planning to primarily place multi bets, and real behavior comes in almost the same at 70%.
- Single bets are only slightly higher in reality. Actual betting shows 30% single vs. 28% in the survey.
What we’d expect to see next:
- Fewer games = fewer traditional parlays. With a smaller slate, multi-game parlays become harder to build.
- More Same-Game Parlays. Bettors who want multi legs still have a clear outlet: stacking outcomes within one matchup.
Where the Money Really Sits: Smaller Bets, More Often
Finally, we compared what bettors said they typically wager in the survey with what we actually observed in the data through the end of the Wild Card round. The pattern is hard to miss: real-world stakes tend to come in lower than the amounts people anticipated before the season.
- Low-stake bets over-index in real behavior. In the data, $1–$5 (26%) and $6–$10 (19%) make up a much larger share than in the survey before the season (8% and 9%, respectively). In practice, bettors place far more “small” bets than they thought.
- The survey overestimates mid-to-higher stakes. The biggest mismatch is in the $51–$100 range: 29% in survey responses vs. only 6% in actual observed behavior. The same pattern shows up again at $101–$499 (19% survey vs. 4% actual).
- The center of gravity shifts downward. Both sources revealed that $11–$50 is the most common range, but actual bets in the data lean even more into it (37% actual vs. 31% survey), suggesting $11-50 is the “true default” stake band.
What we’d expect to see next:
As the playoffs continue, we may likely see:
- More casual bettors enter, which can lower the average stake among those who remain active (lots of people place a bet on the Super Bowl who are “one and done” players)
- As the number of games shrinks, so many bettors may keep stakes conservative and instead express confidence via more legs (parlays) rather than bigger single-ticket amounts.
Conclusion – Why Positionless Marketing Matters
The gap between planned intent and real betting behavior underscores a core reality: player preferences are situational and dynamic, not fixed before the season begins. Bettors shift when they engage, how they bet, and how much they wager based on context, momentum, and the moment.
Meeting players in those moments requires marketing teams to act with speed, flexibility, and precision. That’s where Positionless Marketing becomes essential. By removing dependencies on fixed roles, long planning cycles, and manual handoffs, Positionless Marketing empowers teams to respond immediately to real player behavior, not pre-season assumptions.
Instead of relying on static campaigns built around predicted intent, Positionless Marketing enables marketers to continuously adapt messaging, offers, and journeys as preferences reveal themselves in real time. This ability to move at the player’s speed (and adjust to actual behavior as it unfolds) is what allows operators to stay relevant, personalized, and effective throughout the season.
In an environment where intent rarely matches reality, Positionless Marketing is what turns insight into action at exactly the right moment.
The post Optimove Insight Analysis of NFL 2025-2026 Planned v. Actual NFL Wagering Intentions Through the Wild Card Round appeared first on Americas iGaming & Sports Betting News.


Here are this weeks latest slots releases compiled by Eastern European Gaming
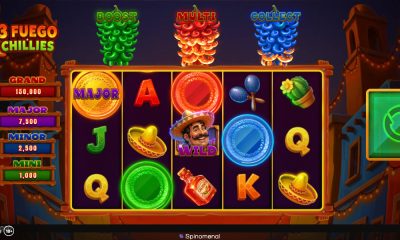
Spinomenal has released 3 Fuego Chillies, a new 5×3 video slot themed around a Mexican street fiesta. The game ships with a feature-led Bonus Game and a top prize billed as a Grand Jackpot of x3,000 the total bet.

CT Interactive has released its latest slot game, 40 Mega Star. As the night sky comes alive with countless shimmering lights, only a select few stars have the power to capture attention and become true Mega Stars.

TaDa Gaming has expanded its popular Unlimited Fortune mechanic with the launch of Joker Coins Unlimited Fortune. Combining Lock & Respin, progressive bonus expansion, jackpots, multipliers and the signature Unlimited Fortune feature, this compact three-reel release delivers layered gameplay and win potential of up to 5000x.

Blueprint Gaming is releasing an upgraded version of Super Graphics Upside Down exclusively on Lottomart, giving Lottomart’s UK players early access to the title. Originally launched in 2021, Super Graphics Upside Down is being re-released with a new bonus wheel feature and an increased max win potential, rising from 250X to 3000X, according to the companies.

ICONIC21 has released Wild Gold Mine 2, a high-volatility sequel to its Wild Gold Mine slot. The game is played across 243 ways and launches with multiple RTP configurations, with a stated top prize of 10,000x.

Games Global has launched Rumble Kong CASHINGO , a new jungle-themed online slot developed with exclusive studio partner Alchemy Gaming. The title went live on 23rd July 2026. Rumble Kong CASHINGO is a 5×5, 3,125 ways-to-win game built around an expanding CASHINGO collection grid.

Swintt has released a new slot from its Elysium Studios label, titled Odyssey Hold & Win. The supplier said the game is built around a Hold & Win collection mechanic and features a stated maximum win of 3,317x. Odyssey Hold & Win runs on a 4×4 grid that can expand to 4×8 when Athena appears, according to the company.

ELA Games has released a new slot, Age of Cleopatra, adding another ancient-Egypt theme title to its portfolio. The studio positions the game as a medium-volatility release and says it is available to demo now. Age of Cleopatra runs on a 5×3 reel set-up with 25 paylines.

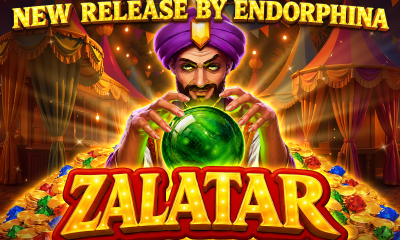
Endorphina has launched Zalatar, a new myths-and-legends themed online slot, expanding its recent run of fantasy-leaning releases. The supplier said Zalatar is a 5-reel, 3-row game with 25 fixed paylines, 96.03% RTP and high volatility.

The post Weekend Reels | Week 30: Slot Drops & Trends appeared first on EE Gaming | Global iGaming & Tech Intelligence Hub.
Slotsoo is proud to announce the winners of the Slotsoo Awards 2026, recognising the online casinos and game providers that have delivered the best player experiences over the past year. Now firmly established as an annual celebration of excellence, the awards continue to recognise the companies setting new standards for quality and innovation across the iGaming industry.
Spotlighting the Best Game Providers of 2026
Following last year’s successful debut, the Slotsoo Game Provider Awards returned for a second year to recognise the studios pushing online slots forward through original ideas, engaging gameplay, and consistently high-quality releases. This year’s winners are:
- The Machine MVP – Pragmatic Play
- Bonus Buyer – Eurasian Gaming
- Volatility Virtuoso – 1spin4win
- Jackpot Jumbo – Platipus Gaming
- Symphony Spinner – Peter & Sons
- Reel Renegade – TaDa Gaming
- Promising Prodigy – EXCO Game Studio
Pragmatic Play retained the prestigious Machine MVP award for a second consecutive year, while every other category crowned a new winner, highlighting the emergence of fresh talent and new ideas among game providers.
Casino Awards Return for a Fourth Year
Since their debut in 2023, the Slotsoo Casino Awards have celebrated the operators raising the standard for online casino experiences. This year’s winners continue that tradition, earning recognition for excellence across bonuses, withdrawals, gamification, and overall quality. The seven winners for 2026 are:
- The Gambling GOAT – Lunar Spins
- The Bonus Buff – Go4Casino
- The Loyalty Lord – Valhalla Wins
- The Withdrawal Wizard – Taste Vegas
- The Gamification Guru – Lucky Fuel
- The Payout Professor – Stupid Casino
- The Noisy Newcomer – Kudos Bet
While the Game Provider Awards saw several first-time winners, the Casino Awards reflected the continued strength of a few established operators. C24 Partners enjoyed a particularly successful year, with four awards going to brands from its portfolio, including the main trophy The Gambling GOAT.
Recognition That Goes Beyond Popularity
Unlike many industry awards, the Slotsoo Awards are not decided by public voting. Winners are selected by the Slotsoo team after evaluating casino operators and game providers throughout the year. Each nominee is assessed on factors such as player value and innovation.
This approach ensures that both established industry leaders and ambitious newcomers have an equal opportunity to be recognised. Whether it’s a casino redefining loyalty rewards or a game studio introducing fresh mechanics, the awards highlight companies that genuinely move the industry forward.
Other News from Slotsoo.com This Summer
The Slotsoo Awards weren’t the only milestone for the company this summer. In June, the team attended the HIPTHER Baltics & Nordics Gaming Conference in Tallinn, connecting with industry professionals, exploring the latest developments in iGaming, and returning home with plenty of inspiration.
July marked the publication of Slotsoo’s first book, The Casino Player’s ABC, written by Markus Björk, Head of Content. This tongue-in-cheek ABC book for adults takes a humorous look at the ups and downs in slot gaming. Markus Björk comments:
“The awards and the book may seem like very different projects, but they share the same goal. Both are about celebrating what makes this industry unique and helping players navigate it with a sense of humour.”
With another successful awards season, the publication of their first book, and an active presence at industry events, 2026 has been one of Slotsoo’s busiest and most exciting years to date.
The post Slotsoo Awards 2026 Celebrate the Best Casinos and Game Providers appeared first on EE Gaming | Global iGaming & Tech Intelligence Hub.
BETBY, the Tier 1 sportsbook supplier, has continued its strong start to 2026, delivering solid year-on-year growth across its business during the first half of the year. Building on the positive Q1 results reported in April, the supplier’s performance was supported by continued market expansion, product innovation, and strong activity across its operator partnerships.
During the first half of 2026, BETBY’s sportsbook Gross Gaming Revenue (GGR) increased by 42.7% compared to H1 2025. The number of active players across the provider’s partner network grew by 47%, while the total number of bets placed rose by 21.2%, reflecting sustained growth across both new and existing operator partnerships.
The period also saw BETBY further expand its product ecosystem through several key launches and developments. Among them was BETBY Predictions, the industry’s first fixed-odds prediction markets feed, opening a new betting vertical for operators. The supplier also introduced Stories, an engagement feature built around a familiar, interactive content format and delivered directly within the sportsbook experience.
The FIFA World Cup provided an additional boost during the last three weeks of June, generating high levels of betting activity across BETBY’s partner network and demonstrating the scalability and reliability of its sportsbook during the world’s largest sporting event.
BETBY’s proprietary esports feed, Betby Games, also delivered continued growth during H1 2026, recording a 28% year-on-year increase in Gross Gaming Revenue. Active players grew by 46%, while the number of bets placed rose by 14.8%. These figures reinforce Betby Games’ importance within BETBY’s broader product portfolio.
Leonid Pertsovskiy, Chief Executive Officer at BETBY, said: “After a strong first quarter, we are pleased to see that the positive trend continued throughout the first half of the year. These results reflect the strength of our long-term strategy, combining continued market expansion with a clear focus on product innovation and helping our partners grow.
“The launch of products such as BETBY Predictions and features like Stories, alongside the continued evolution of Betby Games, demonstrate our commitment to delivering solutions and technology that create measurable value for operators. We are proud of what we have achieved so far this year and remain focused on continuing this progress throughout H2.”
The post BETBY Builds on a Strong Start to 2026 with Solid H1 Sportsbook Growth appeared first on EE Gaming | Global iGaming & Tech Intelligence Hub.

-

 Compliance Updates6 days ago
The MGA Publishes Notice on Websites Impersonating Licensed Operators
-
Alberta6 days ago
Greentube strengthens Canadian presence with Alberta debut as market opens
-
Alberta6 days ago
Greentube goes live in Alberta as province opens regulated iGaming
-
hold and respin6 days ago
Spinomenal releases new slot 3 Fuego Chillies
-
Brazil5 days ago
Hunch cites 78% matchday retention for Super World Cup free-to-play suite
-
Anne Marie Caulfield4 days ago
Irish Gambling Regulator Threatens Prediction Market with High Court Action
-
Brazil5 days ago
Hunch reports 78% matchday retention for Brazil World Cup free-to-play push
-
Canada5 days ago
Tonybet player in Canada claims $20,000 CAD golden World Cup card prize