Latest News
QIWI Announces Third Quarter 2021 Financial Results
QIWI plc, a leading provider of cutting-edge payment and financial services in Russia and the CIS, today announced its financial results for the third quarter ended September 30, 2021.
3Q 2021 Key Operating and Financial Highlights1
| 3Q 2020 | 3Q 2021 | YoY | 9M 2020 | 9M 2021 | YoY | 3Q 2021 | ||||||||||
| RUB million | RUB million | % | RUB million | RUB million | % | USD million(1) | ||||||||||
| Consolidated Group results |
Revenue | 10,833 | 11,746 | 8.4% | 29,663 | 31,793 | 7.2% | 161.4 | ||||||||
| Total Net Revenue | 6,637 | 6,419 | (3.3%) | 19,736 | 17,629 | (10.7%) | 88.2 | |||||||||
| LFL Total Net Revenue(2) | 6,557 | 6,419 | (2.1%) | 18,122 | 17,629 | (2.7%) | 88.2 | |||||||||
| Adjusted EBITDA | 4,020 | 3,834 | (4.6%) | 10,223 | 10,504 | 2.7% | 53 | |||||||||
| Adjusted EBITDA margin | 60.6% | 59.7% | (0.8%) | 51.8% | 59.6% | 7.8% | 59.7% | |||||||||
| Net Profit | 3,043 | 8,836 | 190.4% | 6,479 | 13,423 | 107.2% | 121.4 | |||||||||
| Adjusted Net profit | 3,275 | 2,705 | (17.4%) | 7,785 | 7,470 | (4.0%) | 37.2 | |||||||||
| Adjusted Net profit margin | 49.3% | 42.1% | (7.2%) | 39.4% | 42.4% | 2.9% | 42.1% | |||||||||
| Payment Services (PS) |
PS Net Revenue | 6,108 | 5,855 | (4.1%) | 16,826 | 16,295 | (3.2%) | 80.5 | ||||||||
| PS Payment Net Revenue | 5,303 | 4,856 | (8.4%) | 14,507 | 13,857 | (4.5%) | 66.7 | |||||||||
| PS Payment Volume, billion | 435 | 490 | 12.6% | 1,153 | 1,332 | 15.6% | 6.7 | |||||||||
| PS Payment Net Revenue Yield | 1.22% | 0.99% | (0.2%) | 1.26% | 1.04% | (0.2%) | 0.99% | |||||||||
| PS Other Net Revenue | 805 | 999 | 24.1% | 2,320 | 2,438 | 5.1% | 14 | |||||||||
| Adjusted Net profit | 3,633 | 3,231 | (11.1%) | 9,927 | 8,753 | (11.8%) | 44 | |||||||||
| Adjusted Net profit margin | 59.5% | 55.2% | (4.3%) | 59.0% | 53.7% | (5.3%) | 55.2% | |||||||||
(1) Throughout this release dollar translation calculated using a ruble to U.S. dollar exchange rate of RUB 72.7608 to U.S. $1.00, which was the official exchange rate quoted by the Central Bank of the Russian Federation as of September 30, 2021.
(2) Like-for-like Total Net Revenue excludes discontinued Consumer Financial Services (Sovest) and Rocketbank segments.
Key events in 3Q 2021 and after the reported period
- Alexey Mashchenkov was appointed as CFO of QIWI.
- The Board of Directors approved an interim dividend for 3Q 2021 in the amount of 30 cents per share.
- QIWI completed the sale of its 40% stake (45% economic interest) in Tochka2 resulting in total gain on disposal of RUB 6.2 billion, including RUB 2.7 billion of accrued performance adjustment income contingent to Tochka’s earnings for the year 2021.
- The role of a single Unified Interactive Bets Accounting Center (ETSUP) was announced. Since October 2021 the newly-appointed ETSUP replaced TSUPIS of QIWI. The Company ensured a seamless transition of clients to the ETSUP. QIWI wallet remains a payment method for making bets and receiving winning payouts.
- Factoring PLUS was rebranded into ROWI.
______________________
1 Total Net Revenue, adjusted EBITDA, adjusted EBITDA margin, adjusted Net profit, adjusted Net profit margin, financial results on a like-for-like basis in this release are “non-IFRS financial measures”. Please see the section “Non-IFRS Financial Measures and Supplemental Financial Information” for more details as well as reconciliation at the end of this release.
2021 Guidance3
QIWI upgraded its FY 2021 guidance following strong results for 9M 2021:
- Total Net Revenue is expected to decrease by 10% to 15% YoY;
- Payment Services Net Revenue is expected to decrease by 5% to 10% YoY;
- Adjusted Net Profit is expected to decrease by 10% to 15% YoY.
Our outlook reflects (1) recent changes in the betting industry landscape described in the “Recent developments” section, (2) conservative projections of recovery of cross-borders operations, and (3) sale of stake in Tochka project, previously accounted for under the equity pick-up method.
These are our current views and expectations only which are based on the trends we see as of the day of this press release. If such trends were to deteriorate or improve further the impact on our business and operations could deviate from that currently expected.
The Company reserves the right to revise guidance in the course of the year or when additional information regarding the effect of the ongoing events becomes available.
3Q Results
Net Revenue breakdown by segments4
| 3Q 2020 | 3Q 2021 | YoY | 9M 2020 | 9M 2021 | YoY | 3Q 2021 | ||||||||||
| RUB million | RUB million | % | RUB million | RUB million | % | USD million | ||||||||||
| Total Net Revenue | 6,637 | 6,419 | (3.3 | %) | 19,736 | 17,629 | (10.7 | %) | 88.2 | |||||||
| LFL Total Net Revenue | 6,557 | 6,419 | (2.1 | %) | 18,122 | 17,629 | (2.7 | %) | 88.2 | |||||||
| Payment Services (PS) | 6,108 | 5,855 | (4.1 | %) | 16,826 | 16,295 | (3.2 | %) | 80.5 | |||||||
| PS Payment Net Revenue | 5,303 | 4,856 | (8.4 | %) | 14,507 | 13,857 | (4.5 | %) | 66.7 | |||||||
| PS Other Net Revenue | 805 | 999 | 24.1 | % | 2,320 | 2,438 | 5.1 | % | 13.7 | |||||||
| Consumer Financial Services (СFS) | 64 | – | (100.0 | %) | 1,067 | – | (100.0 | %) | – | |||||||
| Rocketbank | 16 | – | (100.0 | %) | 548 | – | (100.0 | %) | – | |||||||
| Corporate and Other | 449 | 564 | 25.6 | % | 1,295 | 1,334 | 3.0 | % | 7.8 | |||||||
Total Net Revenue from continued operations decreased by 2.1% YoY to RUB 6,419 million ($88.2 million) driven by PS segment Net Revenue decline. Including discontinued operations of Sovest (reflected in CFS) and Rocketbank Total Net Revenue decreased by 3.3% YoY.
PS Net Revenue in 3Q 2021 was RUB 5,855 million ($80.5 million) – 4.1% lower compared to last year driven by decrease of PS Payment Net Revenue.
______________________
3 Guidance is provided in Russian rubles
4 Total Net Revenue, PS Net Revenue, PS Payment Net Revenue, PS Other Net Revenue, СFS Net Revenue, Rocketbank Net Revenue, Corporate and Other Net Revenue in this release are “non-IFRS financial measures”. Please see the section “Non-IFRS Financial Measures and Supplemental Financial Information” for more details as well as reconciliation at the end of this release.
PS Payment segment breakdown by verticals5
| 3Q 2020 | 3Q 2021 | YoY | 9M 2020 | 9M 2021 | YoY | 3Q 2021 | |||||||||
| RUB | RUB | % | RUB | RUB | % | USD | |||||||||
| PS Payment Volume (billion)(1) | 435.4 | 490.5 | 12.6% | 1,152.6 | 1,332.1 | 15.6% | 6.7 | ||||||||
| E-commerce | 133.9 | 118.8 | (11.3%) | 343.3 | 312.4 | (9.0%) | 1.6 | ||||||||
| Financial services | 65.2 | 71.8 | 10.1% | 186.5 | 200.5 | 7.5% | 1.0 | ||||||||
| Money remittances | 185.9 | 261.1 | 40.5% | 472.4 | 694.9 | 47.1% | 3.6 | ||||||||
| Telecom | 36.2 | 28.6 | (21.0%) | 118.9 | 89.3 | (24.9%) | 0.4 | ||||||||
| Other | 14.3 | 10.2 | (28.3%) | 31.5 | 35.0 | 10.9% | 0.1 | ||||||||
| PS Payment Net Revenue (million)(2) | 5,303 | 4,856 | (8.4%) | 14,506 | 13,857 | (4.5%) | 66.7 | ||||||||
| E-commerce | 3,123 | 2,286 | (26.8%) | 8,523 | 6,361 | (25.4%) | 31.4 | ||||||||
| Financial services | 331 | 134 | (59.6%) | 931 | 462 | (50.4%) | 1.8 | ||||||||
| Money remittances | 1,605 | 2,316 | 44.3% | 4,274 | 6,553 | 53.3% | 31.8 | ||||||||
| Telecom | 143 | 115 | (19.2%) | 573 | 392 | (31.6%) | 1.6 | ||||||||
| Other | 102 | 4 | (95.7%) | 206 | 90 | (56.4%) | 0.1 | ||||||||
| PS Payment Net Revenue Yield(3) | 1.22% | 0.99% | (0.23%) | 1.26% | 1.04% | (0.22%) | 0.99% | ||||||||
| E-commerce | 2.33% | 1.93% | (0.41%) | 2.48% | 2.04% | (0.45%) | 1.93% | ||||||||
| Financial services | 0.51% | 0.19% | (0.32%) | 0.50% | 0.23% | (0.27%) | 0.19% | ||||||||
| Money remittances | 0.86% | 0.89% | 0.02% | 0.90% | 0.94% | 0.04% | 0.89% | ||||||||
| Telecom | 0.40% | 0.40% | 0.01% | 0.48% | 0.44% | (0.04%) | 0.40% | ||||||||
| Other | 0.71% | 0.04% | (0.67%) | 0.65% | 0.26% | (0.40%) | 0.04% | ||||||||
(1) PS Payment Volume by market verticals and consolidated payment volume consist of the amounts paid by our customers to merchants or other customers included in each of those market verticals less intra-group eliminations.
(2) PS Payment Net Revenue is calculated as the difference between PS Payment Revenue and PS Cost of Payment Revenue (excluding D&A). PS Payment Revenue primarily consists of merchant and consumer fees. Cost of PS Payment Revenue primarily consists of commission to agents.
(3) PS Payment Net Revenue Yield is defined as PS Payment net revenue divided by Payment Services payment segment volume.
In 3Q 2021 PS Payment Net Revenue decreased by 8.4% YoY and amounted to RUB 4,856 million ($66.7 million) as a result of a decrease of PS Payment Net Revenue Yield by 23bps YoY partially compensated by an increase of the PS Payment volume by 12.6%.
PS Payment Volume increased by 12.6% to RUB 490 billion primarily due to the Money remittance and Financial services verticals.
- Money Remittances vertical went up by 40.5% YoY reaching a historical high level of RUB 261 billion represented by increased volumes across key streamlines, namely (i) B2B2C payments from QIWI wallet accountholders and payouts on cards (up 110% YoY) resulting largely from the development of our product offering for self-employed and increase in peer-to-peer operations, and (ii) repayment of customers’ betting winnings on the QIWI wallet (up 29% YoY).
- Volume growth in the Financial services vertical by 10.1% YoY was driven by increased bank and micro loans repayments.
- E-commerce vertical Volume went down by 11.3% YoY on decrease in payment volumes to foreign merchants due to temporary restrictions imposed by the CBR6 in December 2020 and expired in May 2021 which were partially offset by increased TSUPIS operations and recovery of tourism.
- Telecom volume decreased by 21.0% YoY to RUB 29 billion on lower volumes coming through MNOs7 and adverse impact of the downsizing kiosk network.
- Other category comprising a broad range of merchants in utilities and other government payments as well as charity organizations to which we offer payment processing services decreased by 28.3% YoY to RUB 10 billion.
We note significant growth within the B2B and B2B2C streamlines as we continuously enhance our customer value proposition. These transactions mostly represent use-cases connected to peer-to-peer transactions, light banking, collection of proceeds services we provide to self-employed customers, etc. We believe that significant growth in revenue from peer-to-peer transactions may not be representative of revenue from such transactions in future periods.
______________________
5 Please see the section “Non-IFRS Financial Measures and Supplemental Financial Information” for more details as well as reconciliation at the end of this release.
6 Disclosed in the Report of Foreign Private Issuer on Form 6-K furnished to the SEC on December 9, 2020.
7 Mobile network operators.
A decline in PS Payment Net Revenue Yield by 23bps to 0.99% was mainly driven by a combination of (1) decreased E-commerce Net Revenue Yield by 41bps to 1.93% and (2) lower share of E-commerce vertical in total PS volume by 6.5ppt to 24.2%, both resulting from the temporary restrictions imposed on higher-yielding cross-border payments.
Any changes in the regulatory regime or in the interpretation of current regulations that affect the continuation of one or more types of transactions currently facilitated by our system may materially adversely affect our results of operations.
PS Other Net Revenue breakdown
| 3Q 2020 | 3Q 2021 | YoY | 9M 2020 | 9M 2021 | YoY | 3Q 2021 | ||||||||||
| RUB million | RUB million | % | RUB million | RUB million | % | USD million | ||||||||||
| PS Other Net Revenue | 805 | 999 | 24.1 | % | 2,320 | 2,438 | 5.1 | % | 13.7 | |||||||
| Fees for inactive accounts and unclaimed payments | 506 | 441 | (12.8 | %) | 1,497 | 1,295 | (13.5 | %) | 6.1 | |||||||
| Other Net Revenue | 299 | 558 | 86.8 | % | 823 | 1,143 | 38.9 | % | 7.7 | |||||||
PS Other Net Revenue increased by 24.1% YoY and stood at RUB 999 million ($13.7 million).
Fees for inactive accounts and unclaimed payments were RUB 441 million ($6.1 million) or 12.8% lower compared to 3Q 2020 due to extension of inactivity terms from 6 to 12 months as well as decreased number of QIWI wallet accounts.
Other Net Revenue largely composed of interest revenue, revenue from overdrafts provided to agents, and advertising increased by 86.8% YoY up to RUB 558 million ($7.7 million) mainly driven by higher interest revenue on more efficient cash allocation underpinned by increased interest rates.
Payment Services other operating data
| September 30, 2020 | September 30, 2021 | YoY % | |||||||||||||
| Active kiosks and terminals (units)(1) | 117,137 | 96,369 | (17.7 | %) | |||||||||||
| Active QIWI wallet accounts (million)(2) | 19.7 | 14.9 | (24.5 | %) | |||||||||||
(1) We measure the numbers of our kiosks and terminals on a daily basis, with only those kiosks and terminals being taken into calculation through which at least one payment has been processed during the day, which we refer to as active kiosks and terminals. The period end numbers of our kiosks and terminals are calculated as an average of the number of active kiosks and terminals for the last 30 days of the respective reporting period.
(2) Active QIWI wallet accounts calculated on a yearly basis, i.e. an active account is an account that had at least one transaction within the last 12 months from the reporting date.
The number of active kiosks and terminals was 96,370, including Contact and Rapida physical points of service, a decrease of 17.7% compared to the previous year. The number of kiosks and terminals is generally decreasing as market evolves towards a higher share of digital payments. Nevertheless, our physical distribution network remains an important part of our omni-channel infrastructure allowing consumers to use physical currency for online payments and offering merchants access to a large pool of customers that use cash.
The number of active QIWI wallet accounts was 14.9 million as of the end of 3Q 2021, a decrease of 4.8 million YoY. The decrease primarily resulted from the introduction of limitations on the anonymous wallets and enhancement of certain KYC, identification and compliance procedures. The number of active QIWI wallets was also affected by the CBR restrictions imposed in December 2020 resulting in outflow of clients that customarily used our services specifically for payments to merchants that have become subject to the restrictions. We also note 1.3 million of QIWI wallet accounts previously created solely for the purposes of making bets via QIWI TSUPIS using other than QIWI wallet payment method. These QIWI wallets are at risk as QIWI stopped providing TSUPIS services in October 2021. We are focused on diversification of our product proposition and increase of payment volumes per QIWI wallet account. In 3Q 2021 payment volume per active QIWI wallet account8 was 92% higher YoY.
Corporate and Other (CO) Net Revenue breakdown
| 3Q 2020 | 3Q 2021 | YoY | 9M 2020 | 9M 2021 | YoY | 3Q 2021 | ||||||||||
| RUB million | RUB million | % | RUB million | RUB million | % | USD million | ||||||||||
| CO Net Revenue | 449 | 564 | 25.6 | % | 1,295 | 1,334 | 3.0 | % | 7.8 | |||||||
| Tochka | 126 | 126 | 0.4 | % | 457 | 282 | (38.3 | %) | 1.7 | |||||||
| ROWI | 182 | 295 | 61.8 | % | 488 | 670 | 37.4 | % | 4.1 | |||||||
| Flocktory | 135 | 152 | 13.2 | % | 341 | 412 | 20.8 | % | 2.1 | |||||||
| Corporate and Other projects | 6 | (10 | ) | (262.3 | %) | 10 | (30 | ) | (409.8 | %) | (0.1 | ) | ||||
CO Net Revenue in 3Q 2021 increased by 25.6% YoY to RUB 564 million ($7.8 million) driven by ROWI, Flocktory and Other projects Net Revenue growth:
- Tochka Net Revenue remained generally flat YoY and stood at RUB 126 million ($1.7 million). In the 3Q 2021 QIWI completed the sale of its 40% stake (45% economic interest) in the capital of Tochka associate to Otkritie Bank. The Company continues to work with Tochka and Otkritie Bank on joint B2B2C projects providing a bundle of services for taxi, courier delivery, transportation companies, self-employed individuals and other users.
- In 3Q 2021 QIWI Factoring business was rebranded into ROWI. ROWI Net Revenue increased by 61.8% YoY to RUB 295 million ($4.1 million) on further expansion of bank guarantees and factoring portfolios as well as launch of new products:
- Bank Guarantees portfolio increased by 86% YoY to RUB 31.2 billion with average check growth by 66% to RUB 1.1 million.
- Factoring portfolio increased by 83% YoY and reached RUB 7.0 billion with number of active clients going up by 48% YoY to 592.
- In 3Q ROWI launched two new finance products – online loans for government contracts execution and loans for marketplaces suppliers based on sales analytics. Net Revenue of new products in 3Q 2021 reached RUB 28 million.
- Flocktory Net Revenue increased by 13.2% YoY and reached RUB 152 million ($2.1 million) driven by growing number of clients and traffic-providers using Flocktory’s platform and marketing services underpinned by growth of average check.
- Corporate and Other projects Net Revenue include result of operations of different projects in the start-up stage and in 3Q 2021 it amounted to RUB 10 million ($0.1 million) of loss.
______________________
8 Payment volume per active QIWI wallet account for the period is calculated as total amount of outgoing payments for the period including peer-to-peer transactions divided by number of active QIWI wallet accounts involved in transactions within the period.
Operating expenses and other non-operating income and expenses
| 3Q 2020 | 3Q 2021 | YoY | 9M 2020 | 9M 2021 | YoY | 3Q 2021 | ||||||||||
| RUB million | RUB million | % | RUB million | RUB million | % | USD million | ||||||||||
| Operating expenses | (3,026 | ) | (2,874 | ) | (5.0 | %) | (10,764 | ) | (8,005 | ) | (25.6 | %) | (39.5 | ) | ||
| % of Net Revenue | (45.6%) | (44.8%) | 0.8% | (54.5%) | (45.4%) | 9.1% | ||||||||||
| Selling, general and administrative expenses | (711) | (986) | 38.7% | (2,634) | (2,147) | (18.5%) | (13.6) | |||||||||
| % of Net Revenue | (10.7%) | (15.4%) | (4.6%) | (13.3%) | (12.2%) | 1.2% | ||||||||||
| Personnel expenses | (1,983) | (1,496) | (24.6%) | (6,204) | (4,726) | (23.8%) | (20.6) | |||||||||
| % of Net Revenue | (29.9%) | (23.3%) | 6.6% | (31.4%) | (26.8%) | 4.6% | ||||||||||
| Depreciation, amortization & impairment | (317) | (289) | (8.8%) | (1,101) | (872) | (20.8%) | (4.0) | |||||||||
| % of Net Revenue | (4.8%) | (4.5%) | 0.3% | (5.6%) | (4.9%) | 0.6% | ||||||||||
| Credit loss (expense) | (15) | (103) | 586.7% | (825) | (260) | (68.5%) | (1.4) | |||||||||
| % of Net Revenue | (0.2%) | (1.6%) | (1.4%) | (4.2%) | (1.5%) | 2.7% | ||||||||||
| Other non-operating income and expenses excluding gain on disposal of an associate | 321 | 36 | (88.8%) | (441) | 200 | (145.4%) | 0.5 | |||||||||
| % of Net Revenue | 4.8% | 0.6% | (4.3%) | (2.2%) | 1.1% | 3.4% | ||||||||||
| Share of gain of an associate and a joint venture | 256 | – | (100.0%) | 495 | 306 | (38.2%) | – | |||||||||
| % of Net Revenue | 3.9% | 0.0% | (3.9%) | 2.5% | 1.7% | (0.8%) | ||||||||||
| Foreign exchange loss, net | 125 | 3 | (97.6%) | (130) | (39) | (70.0%) | 0.0 | |||||||||
| % of Net Revenue | 1.9% | 0.0% | (1.8%) | (0.7%) | (0.2%) | 0.4% | ||||||||||
| Interest income and expenses, net | (23) | 2 | 108.7% | (88) | (25) | 71.6% | 0.0 | |||||||||
| % of Net Revenue | (0.3%) | 0.0% | 0.4% | (0.4%) | (0.1%) | 0.3% | ||||||||||
| Other income and expenses, net | (37) | 31 | 183.8% | (718) | (42) | 94.2% | 0.4 | |||||||||
| % of Net Revenue | (0.6%) | 0.5% | 1.0% | (3.6%) | (0.2%) | 3.4% | ||||||||||
| Gain on disposal of an associate | – | 6,213 | – | 6,213 | 85.4 | |||||||||||
| % of Net Revenue | 96.8% | 35.2% | ||||||||||||||
Operating expenses went down by 5.0% YoY to RUB 2,874 million ($39.5 million) and improved by 82bps to 44.8% as percent of Total Net Revenue driven by divestiture of Rocketbank project that offset Total Net Revenue decline due to temporary restrictions imposed on cross-border payments.
Selling, general and administrative expenses increased by 38.7% to RUB 986 million ($13.6 million). SG&A expenses as percent of Total Net Revenue increased by 4.6ppt YoY to 15.4% primarily due to (i) advisory services for market research while reviewing Company’s strategy and (ii) higher tax expenses as a result of increased share of operations with financial companies which are non-deductible for VAT purposes.
Personnel expenses decreased by 24.6% YoY to RUB 1,496 million ($20.6 million) and improved by 6.6ppt to 23.3% as percent of Total Net Revenue primarily driven by divestiture of Rocketbank project.
Depreciation, amortization and impairment decreased by 27bps YoY to 4.5% as percent of Total Net Revenue driven by divestiture of Rocketbank project.
Credit loss increased by 1.4ppt YoY to 1.6% as percent of Total Net Revenue driven by provisions accrued in 3Q 2021 resulting from ROWI business portfolio growth and other factors.
Other non-operating income and expenses excluding gain on disposal of an associate in 3Q decreased by 88.8% YoY to RUB 36 million ($0.5 million) mainly driven by (i) no contribution from Tochka equity pick up due to sales of stake in the project, and (ii) lower forex exchange gain driven by currency rates fluctuations. Other insignificant changes are driven by divestiture of Rocketbank project.
Gain on disposal of an associate in the 3Q 2021 resulted from sale of stake in Tochka and stood at RUB 6.2 billion including: (i) base deal amount of RUB 4.95 billion, (ii) accrued expected performance adjustment gain contingent on Tochka’s earnings for the year 2021 in the amount of RUB 2.7 billion, (iii) dividends received in 3Q in the amount of RUB 0.5 billion, and (iv) less carrying amount of disposed investment in the amount of RUB 1.95 billion. Contingent amount is expected to be received in 2Q 2022.
Income tax expense
Income tax expense increased by 7.8% YoY to RUB 958 million mainly resulting from divesture of SOVEST and Rocketbank projects. Effective tax rate in 3Q 2021 was 12.8ppt lower YoY and stood at 9.8% as a result of recognition of non-taxable gain on disposal of Tochka.
Profitability results
| 3Q 2020 | 3Q 2021 | YoY | 9M 2020 | 9M 2021 | YoY | 3Q 2021 | ||||||||||
| RUB million | RUB million | % | RUB million | RUB million | % | USD million | ||||||||||
| Adjusted EBITDA | 4,020 | 3,834 | (4.6%) | 10,223 | 10,504 | 2.7% | 52.7 | |||||||||
| Adjusted EBITDA margin, % | 60.6% | 59.7% | (0.8%) | 51.8% | 59.6% | 7.8% | 59.7% | |||||||||
| Adjusted Net Profit | 3,275 | 2,705 | (17.4%) | 7,785 | 7,470 | (4.0%) | 37.2 | |||||||||
| Adjusted Net Profit margin, % | 49.3% | 42.1% | (7.2%) | 39.4% | 42.4% | 2.9% | 42.1% | |||||||||
| Payment Services | 3,633 | 3,231 | (11.1%) | 9,927 | 8,753 | (11.8%) | 44.4 | |||||||||
| PS Net Profit margin, % | 59.5% | 55.2% | (4.3%) | 59.0% | 53.7% | (5.3%) | 55.2% | |||||||||
| Consumer Financial Services | (137) | – | (100.0%) | (793) | – | (100.0%) | – | |||||||||
| Rocketbank | (165) | – | (100.0%) | (781) | – | (100.0%) | – | |||||||||
| Corporate and Other (CO) | (56) | (526) | (848.2%) | (568) | (1,283) | (125.8%) | (7.2) | |||||||||
| Tochka | 281 | 5 | (98.3%) | 590 | 328 | (44.4%) | 0.1 | |||||||||
| ROWI | 72 | 122 | 69.7% | 164 | 156 | (4.6%) | 1.7 | |||||||||
| Flocktory | 44 | (6) | (114.3%) | 57 | (109) | (291.7%) | (0.1) | |||||||||
| Corporate and Other projects | (453) | (647) | (42.7%) | (1,378) | (1,658) | (20.3%) | (8.8) | |||||||||
Adjusted EBITDA decreased by 4.6% YoY to RUB 3,834 million ($52.7 million) driven by Total Net Revenue decline and modest Adjusted EBITDA margin decline by 84bps to 59.7%. Adjusted EBITDA margin decreased mainly due to PS Payment Net Revenue decline partially offset by optimization measures resulting from divesture of Rocketbank project.
Adjusted Net Profit in 3Q 2021 decreased by 17.4% YoY to RUB 2,705 million ($37.2 million). Adjusted Net Profit margin declined by 7.2ppt and stood at 42.1% driven by (i) Adjusted EBITDA dynamics, (ii) no share gain from Tochka associate, and (iii) lower forex exchange gain.
Payment Services Net Profit decreased by 11.1% YoY to RUB 3,231 million ($44.4 million) as a result of a combination of PS Net Revenue decline by 4.1% YoY mainly due to temporary restrictions imposed on higher-yielding cross-border payments and PS Net Profit margin contraction by 4.3ppt to 55.2% primarily driven by higher tax expenses due to changing base for VAT and adverse forex exchange impact.
CO Net Loss in 3Q 2021 increased to RUB 526 million ($7.2 million) driven primarily by the following factors:
- Corporate and Other projects Net Loss in 3Q 2021 increased by 42.7% YoY to RUB 647 million mainly due to advisory services for market research while reviewing Company’s strategy, increased costs for insurance of Directors and Officers and higher income tax expenses.
- Tochka Net Profit decreased to RUB 5 million followed by sale of QIWI stake in the project.
- ROWI Net Profit increased by 69.7% YoY to RUB 122 million as a result of project scale up reflected in portfolio growth.
- Flocktory Net Loss in 3Q 2021 stood at RUB 6 million primarily driven by (i) increased personnel expenses mainly due to selective review of salaries and new hires, and (ii) negative forex exchange impact.
Consolidated cash flow statement
| 9M 2020 | 9M 2021 | YoY | 9M 2021 | |||||||
| RUB million | RUB million | % | USD million | |||||||
| Net cash generated from operating activities before changes in working capital | 8,724 | 8,762 | 0.4 | % | 120.4 | |||||
| Change in working capital | (6,012 | ) | (13,672 | ) | 127.4 | % | (187.9 | ) | ||
| Net interest and income tax paid | 735 | (16 | ) | (102.2 | %) | (0.2 | ) | |||
| Net cash flow used in operating activities | 3,447 | (4,926 | ) | (242.9 | %) | (67.7 | ) | |||
| Net cash received from investing activities | 684 | (33 | ) | (104.8 | %) | (0.5 | ) | |||
| Net cash used in from financing activities | (3,438 | ) | (4,805 | ) | 39.8 | % | (66.0 | ) | ||
| Effect of exchange rate changes on cash and cash equivalents | 1,411 | (140 | ) | (109.9 | %) | (1.9 | ) | |||
| Net decrease in cash and cash equivalents | 2,104 | (9,904 | ) | (570.7 | %) | (136.1 | ) | |||
| Cash and cash equivalents at the beginning of the period | 42,101 | 47,382 | 12.5 | % | 651.2 | |||||
| Cash and cash equivalents at the end of the period | 44,205 | 37,478 | (15.2 | %) | 515.1 | |||||
Net cash generated from operating activities before changes in working capital for 9M 2021 slightly increased by 0.4% YoY to RUB 8,762 million ($120.4 million) as decrease in Net Revenue by 10.7% YoY due to temporary suspension of cross-border operations was compensated by improved profitability on divesture of loss making SOVEST and Rocketbank projects. Net cash flow used in operating activities for 9M 2021 stood at RUB 4,926 million ($67.7 million) driven by significant changes in working capital and increased income tax paid. Change in working capital for 9M 2021 resulted in cash outflow of RUB 13,672 million primarily due to (i) lower accounts payable and accruals of RUB 10,444 million resulted from discontinuation of payments to foreign merchants on the back of the temporary CBR prescriptions related to cross-border operations; (ii) decrease in customer accounts and amounts due to banks in the amount of RUB 4,163 million driven predominantly due to the wind-down of Rocketbank and seasonality; (iii) increase in loans issued from banking operations of RUB 2,418 million mainly related to ROWI business development, and (iv) decrease in trade and other receivables by RUB 2,125 million mainly due to seasonal factor. Net interest and income tax paid increased by RUB 751 million mainly resulting from divesture of loss making SOVEST and Rocketbank projects.
Net cash flow used in investing activities for 9M 2021 stood at RUB 33 million ($0.5 million). The net cash outflow was primarily driven by purchase of debt securities in the amount of RUB 8.1 billion, which was partially offset by proceeds from sale of Tochka of RUB 4.95 billion.
Net cash flow used in financing activities for 9M 2021 increased by 39.8% YoY to RUB 4,805 million ($66.0 million). The increase in net cash outflow was primarily driven by (i) repayment of borrowings of RUB 649 million and (ii) higher dividend payments during 9M 2021 by RUB 621 million compared to the same period of last year due to an increase of distributable profit and lower payout ratio in 2020 due to the COVID-19 outbreak.
As a result of factors described above cash and cash equivalents as of September 30, 2021 were RUB 37,478 million ($515.1 million) – a decrease by 15.2% compared to September 30, 2020.
Dividends
In March 2021, the Board of Directors has approved a target dividend payout ratio for 2021. In accordance with the decision of the Board of Directors, the Company aims to distribute at least 50% of Group Adjusted Net Profit for 2021.
Following the determination of 3Q 2021 financial results and taking into consideration the current operating environment, the Board of Directors approved a dividend of USD 30 cents per share. The dividend record date is December 6, 2021, and the Company intends to pay the dividend on December 8, 2021. The holders of ADSs will receive the dividend shortly thereafter.
The Board of Directors reserves the right to distribute the dividends on a quarterly basis, as it deems necessary so that the total annual payout is in accordance with the target range provided, though the payout ratios for each of the quarters may vary and be outside of this range.
Recent Developments
Betting industry regulation
Since 2016, we have been operating an Interactive Bets Accounting Center (TSUPIS), which we established together with one of the self-regulated associations of bookmakers in order to enable us to accept electronic bets on behalf of sports betting companies and process related payments. In December 2020, a new law was adopted, establishing a Unified Gambling Regulator as a new governmental agency with broad authority to oversee the betting market, and creating the role of a single Unified Interactive Bets Accounting Center (ETSUP). QIWI made a proposal to serve as the ETSUP but it was not successful. Since October 2021, the newly-appointed ETSUP solely processes betting operations replacing both TSUPIS operators. As a result, QIWI lost the ability to generate volume and income directly related to TSUPIS business in Russia starting from 4Q 2021. It will most likely also affect our acquiring services provided to sports betting companies in a bundle with TSUPIS operations. At the same time, part of the betting revenues generated from QIWI wallet services, including commissions for betting accounts top-ups and winning payouts are expected to be retained. We note that there can be no assurance that recent changes will not have adverse impact on the overall usage of QIWI wallet.
The combined betting stream for 9M 2021 represented 26% (or RUB 351.6 billion) of PS Payment Volume and 38% (or RUB 5,225 million) of PS Payment Net Revenue. QIWI’s TSUPIS business and related acquiring services for 9M 2021 accounted 23% (or RUB 3,246 million) of PS Payment Net Revenue.
We are looking for different options to share our expertise and technologies to transform and secure our place on the new betting landscape.
Earnings Conference Call and Audio Webcast
QIWI will host a conference call to discuss 3Q 2021 financial results today at 8:30 a.m. ET. (1:30 p.m. London time; 4:30 p.m. Moscow time)
Hosting the call will be (i) Andrey Protopopov, CEO, (ii) Alexey Mashchenkov, CFO and (iii) Elena Nikonova, Deputy CFO for Corporate Finance.
To participate in the conference call, please use the following details:
| Live call | Toll Free (US) Toll International Toll Free (Russia) |
+1 (877) 407-3982 +1 (201) 493-6780| 88 00 100 6268 |
| Replay | Toll Free (US) Toll International |
+1 (844) 512-2921 +1 (412) 317-6671 |
| available since Tuesday, November 23, 2021, 11:30 a.m. ET till Tuesday, December 7, 2021 | ||
| Confirmation Code | 13724831 | |
Powered by WPeMatico

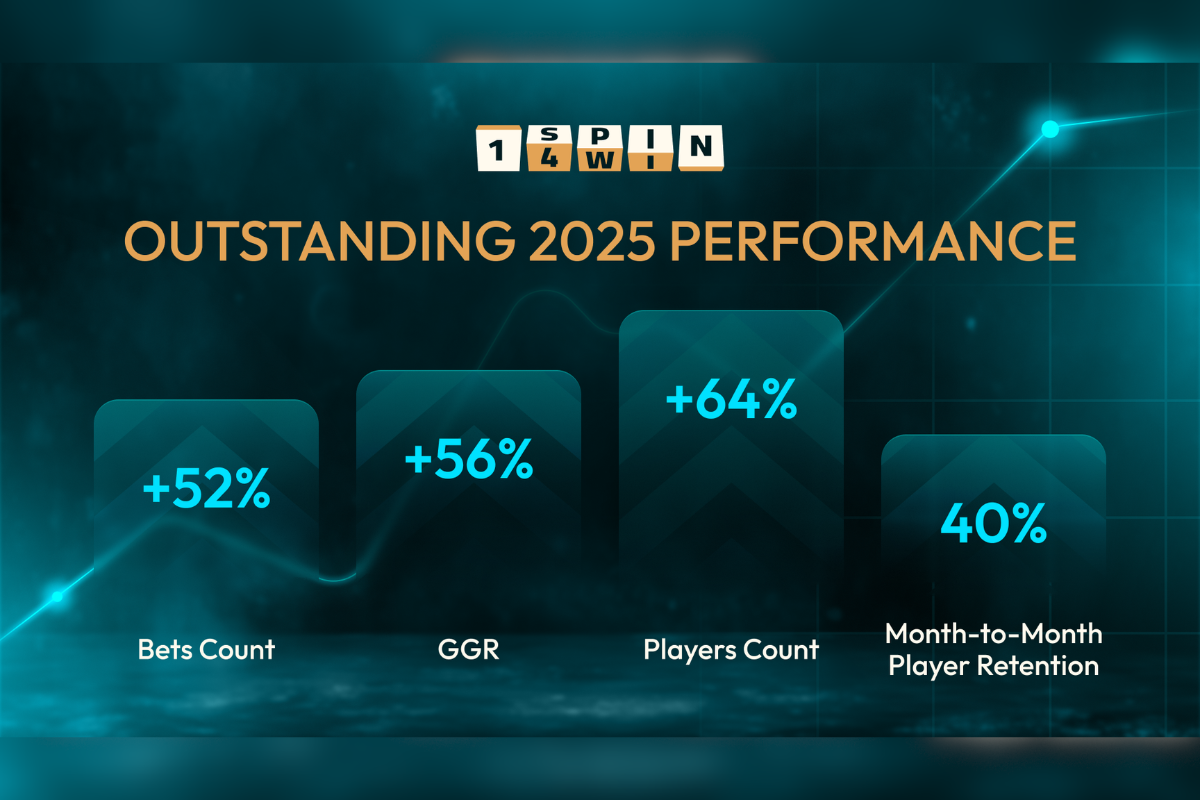
The studio reflects on a successful 2025, marked by major performance milestones, new partnerships, and continued market expansion. Among the year’s key achievements was a 56% increase in GGR compared to 2024.
One of the primary drivers behind this growth was the strengthening of collaboration with clients. Last year, the 1spin4win company reached the milestone of 1,000 global partnerships. The slot provider is now trusted by leading aggregators, including SOFTSWISS Game Aggregator, EveryMatrix, Alea, Digitain, and BetConstruct, among others.
Throughout 2025 and in 2026, the studio’s month-to-month retention rate consistently exceeded 40%, highlighting strong, long-term player loyalty. The main contributor to this figure was the 1spin4win portfolio of over 190 classic online slots, regularly updated with four, sometimes five, monthly releases. In 2025, the provider launched 52 titles, presented 10 branded games for partners, and introduced 12 new mechanics.
Recognized for their well-balanced gameplay and transparent math models, 1spin4win’s classic offering also contributed to a robust 64.24% surge in player count and a 52.06% rise in bet count.
Olga Hlukhovskaya, Business Development Director at 1spin4win, shared, “2025 was an outstanding year for us. Alongside the continued success of our slots, our expansion into both new and existing markets also played a significant role in this growth. While maintaining a strong presence in Europe, we significantly strengthened our position in Latin America and Africa. We’re excited to carry this momentum into 2026 and push our games and partnerships even further.”
About 1spin4win
1spin4win is a trusted game provider founded in May 2021 by ambitious developers with over 15 years of experience in the gambling industry. Since its inception, the company has expanded its portfolio to include over 190 classic online slots, all characterized by quality mathematics, transparent mechanics, and well-balanced gameplay — key factors that drive strong player retention. The studio aims to release an average of four new games each month in 2026 and offers effective promotional tools for casino operators to help them enhance player loyalty.
The post 1spin4win reveals key 2025 performance results, including a 56% surge in GGR appeared first on Eastern European Gaming | Global iGaming & Tech Intelligence Hub.

The studio reflects on a successful 2025, marked by major performance milestones, new partnerships, and continued market expansion. Among the year’s key achievements was a 56% increase in GGR compared to 2024.
One of the primary drivers behind this growth was the strengthening of collaboration with clients. Last year, the 1spin4win company reached the milestone of 1,000 global partnerships. The slot provider is now trusted by leading aggregators, including SOFTSWISS Game Aggregator, EveryMatrix, Alea, Digitain, and BetConstruct, among others.
Throughout 2025 and in 2026, the studio’s month-to-month retention rate consistently exceeded 40%, highlighting strong, long-term player loyalty. The main contributor to this figure was the 1spin4win portfolio of over 190 classic online slots, regularly updated with four, sometimes five, monthly releases. In 2025, the provider launched 52 titles, presented 10 branded games for partners, and introduced 12 new mechanics.
Recognized for their well-balanced gameplay and transparent math models, 1spin4win’s classic offering also contributed to a robust 64.24% surge in player count and a 52.06% rise in bet count.
Olga Hlukhovskaya, Business Development Director at 1spin4win, shared, “2025 was an outstanding year for us. Alongside the continued success of our slots, our expansion into both new and existing markets also played a significant role in this growth. While maintaining a strong presence in Europe, we significantly strengthened our position in Latin America and Africa. We’re excited to carry this momentum into 2026 and push our games and partnerships even further.”
About 1spin4win
1spin4win is a trusted game provider founded in May 2021 by ambitious developers with over 15 years of experience in the gambling industry. Since its inception, the company has expanded its portfolio to include over 190 classic online slots, all characterized by quality mathematics, transparent mechanics, and well-balanced gameplay — key factors that drive strong player retention. The studio aims to release an average of four new games each month in 2026 and offers effective promotional tools for casino operators to help them enhance player loyalty.
The post 1spin4win reveals key 2025 performance results, including a 56% surge in GGR appeared first on Americas iGaming & Sports Betting News.

Galaxy Gaming Inc., the world’s largest independent developer and distributor of casino table games and technology, is going to showcase its latest innovations at the Indian Gaming Tradeshow & Convention (IGA). At booth #2551, Galaxy Gaming will highlight its industry-leading portfolio of table games, progressive systems, and licensed content designed to drive performance on the casino floor.
“We’re looking forward to connecting with tribal operators and demonstrating how Galaxy Gaming continues to evolve table games. From iconic licensed experiences like MONOPOLY to our cutting-edge progressive technology, and proven titles like EZ Baccarat, and Player’s Edge, we’re focused on delivering games that engage players and generate meaningful results for our tribal partners. Our commitment to Deal Excitement is on full display at IGA,” said Matt Reback, President and CEO of Galaxy Gaming.
MONOPOLY Reimagined for the Casino Pit
Through an exclusive licensing agreement with Hasbro for table games and ETGs, Galaxy Gaming has brought one of the most recognizable brands in the world, MONOPOLY, to the casino table game pit in a bold new way. The MONOPOLY-branded table games combine familiar brand elements with innovative mechanics, progressive features, and eye-catching visuals, creating a premium player experience that blends nostalgia with modern gameplay.
Built to attract both core and casual players, the MONOPOLY Table Game Progressive delivers added excitement through engaging bonus events and scalable progressive jackpots, making it a standout attraction on the casino floor. It’s perfectly paired with the brand-new Ride Free MONOPOLY edition, which includes exciting bonus wagers like Free Parking, Get Out of Jail Free, and Ride Free!.
Dealing Excitement with GOS Sapphire
Also featured at IGA is GOS Sapphire, Galaxy Gaming’s next-generation table game operating system. GOS Sapphire powers the industry’s most dynamic table game progressives with advanced jackpot configurations, sleek Nebula sensors, and real-time digital tracking. Its flexible electronic bonusing capabilities—including Dynamic Progressive, which can award random multipliers of up to 10x—add excitement to every round of play.
GOS Sapphire also allows operators to link jackpots across multiple tables and properties, providing scalable solutions that enhance both player engagement and operational efficiency.
The Most Comprehensive Table Games Portfolio
Galaxy Gaming continues to offer the most robust table games library in the industry. From proven favorites like 21+3, Lucky Ladies, and EZ Baccarat, to innovative branded and proprietary titles, Galaxy delivers solutions designed to perform across a wide range of tribal casino environments.
Also on showcase at IGA 2026 is Player’s Edge 21 with the electrifying Monster Match Progressive, which thrills players with frighteningly fun animations and multipliers of up to 10X.
The post Galaxy Gaming to Participate in Indian Gaming Tradeshow & Convention 2026 appeared first on Americas iGaming & Sports Betting News.

-

 Africa7 days ago
BetConstruct AI to Drive Global Innovation and Strategic Growth AcrossKey Markets in LatAm, Asia, and Africa
-
Centurion Winner Grand Chance™5 days ago
New from Inspired: Luck It Up™ and Centurion Winner Grand Chance™ available online & on mobile
-
Blazin' Bonus6 days ago
Booming Games releases Blazin’ Bonus
-
Cristiano Blanco CEO of SpinCore Group6 days ago
SpinCore Group Enters Finnish Market via Finnplay Partnership
-
Australasian Hospitality and Gaming Expo6 days ago
IGT Showcases Integrated Gaming, Systems, and FinTech Innovations Designed to Drive Growth at Australasian Hospitality and Gaming Expo 2026
-
Asia7 days ago
Mumbai to Host the Prestigious Global Esports Games (GEG) World Finals from March 19–22
-
Africa7 days ago
BetConstruct AI Fuels Global Innovation Strategy Across Latin America, Asia and Africa
-
Conferences5 days ago
NOVOMATIC Gaming Colombia to Showcase its Latest Innovations at GAT Cartagena 2026