Latest News
Churchill Downs Incorporated Reports 2024 Fourth Quarter and Full Year Results

Churchill Downs Incorporated (Nasdaq: CHDN) (the “Company”, “CDI”, “we”) today reported business results for the quarter and full year ended December 31, 2024.
Company Highlights
- Record fourth quarter 2024 financial results compared to the prior year:
- Net revenue of $624.2 million, up $63.0 million or 11%
- Net income attributable to CDI of $71.7 million, up $14.1 million or 24%
- Adjusted EBITDA of $236.6 million, up $17.5 million or 8%
- Record 2024 financial results compared to the prior year:
- Net revenue of $2.7 billion, up $272.6 million or 11%
- Net income attributable to CDI of $426.8 million, up $9.5 million or 2%
- Adjusted EBITDA of $1.2 billion, up $135.3 million or 13%
- We successfully ran the 150th Kentucky Derby on the first Saturday of May generating all-time record all-sources handle and all-time record Derby Week Adjusted EBITDA.
- We opened the Terre Haute Casino Resort in Indiana in April 2024, and the hotel in May 2024.
- The Rose Gaming Resort opened in Dumfries, Virginia in November 2024, with 1,650 historical racing machines and a 102-room hotel as our eighth HRM entertainment venue in Virginia.
- We opened Owensboro Racing & Gaming in Owensboro, Kentucky on February 12, 2025, with 600 historical racing machines, a retail sportsbook, simulcast wagering, and food and beverage offerings.
- We ended 2024 with net bank leverage of 4.0x and returned $218.3 million of capital to shareholders through share repurchases and dividends.
| CONSOLIDATED RESULTS |
| Fourth Quarter | Years Ended December 31 | ||||||||||
| (in millions, except per share data) | 2024 | 2023 | 2024 | 2023 | |||||||
| Net revenue | $ | 624.2 | $ | 561.2 | $ | 2,734.3 | $ | 2,461.7 | |||
| Net income attributable to CDI | $ | 71.7 | $ | 57.6 | $ | 426.8 | $ | 417.3 | |||
| Diluted EPS attributable to CDI | $ | 0.95 | $ | 0.76 | $ | 5.68 | $ | 5.49 | |||
| Adjusted EBITDA(a) | $ | 236.6 | $ | 219.1 | $ | 1,159.2 | $ | 1,023.9 | |||
| (a) This is a non-GAAP measure. See explanation of non-GAAP measures below. | |||||||||||
| SEGMENT RESULTS |
The summaries below present revenue from external customers and intercompany revenue from each of our reportable segments. We have changed the name of the TwinSpires segment to Wagering Services and Solutions to better reflect the businesses that are within this segment. All comparisons are against the applicable prior year period unless otherwise noted.
Live and Historical Racing
| Fourth Quarter | Years Ended December 31, | ||||||||||
| (in millions) | 2024 | 2023 | 2024 | 2023 | |||||||
| Revenue | $ | 275.5 | $ | 235.3 | $ | 1,267.0 | $ | 1,084.6 | |||
| Adjusted EBITDA | 101.6 | 88.9 | 574.6 | 475.4 | |||||||
Fourth Quarter 2024
Fourth quarter 2024 revenue increased $40.2 million due to a $19.6 million increase primarily from the opening of The Rose Gaming Resort in Northern Virginia, a $10.4 million increase from our other Virginia HRM venues, a $4.1 million increase from our Southwestern Kentucky HRM venue, a $2.7 million increase at Churchill Downs Racetrack, a $2.1 million increase from our Northern Kentucky HRM venues, and a $1.3 million net increase from our other HRM venues.
Fourth quarter 2024 Adjusted EBITDA increased $12.7 million due to a $5.2 million increase primarily from the opening of The Rose Gaming Resort in Northern Virginia, a $7.6 million increase from our other Virginia HRM venues, a $2.1 million increase from our Southwestern Kentucky HRM venue, and a $1.5 million increase from our Northern Kentucky HRM venues. These increases were offset by a $1.8 million decrease related to an increase in government relations expense allocated to Virginia, a $1.3 million decrease at Churchill Downs Racetrack and a $0.6 million decrease at our other HRM venues.
Full Year 2024
Full year 2024 revenue increased $182.4 million due to a $57.2 million increase at Churchill Downs Racetrack due to a record-breaking 150th Derby Week, a $25.9 million increase in Northern Virginia including the opening of The Rose Gaming Resort, a $17.2 million increase from the opening of the Rosie’s Emporia HRM venue in Southern Virginia in September 2023, a $39.5 million increase from our other Virginia HRM venues, a $41.5 million increase from our Kentucky HRM venues, and a $1.1 million increase from our New Hampshire venue.
Full year 2024 Adjusted EBITDA increased $99.2 million due to a $32.6 million increase at Churchill Downs Racetrack due to a record-breaking 150th Derby Week, $9.7 million increase in Northern Virginia including the opening of The Rose Gaming Resort, a $7.1 million increase from the opening of the Rosie’s Emporia HRM venue in Southern Virginia in September 2023, a $38.3 million increase from our other Virginia HRM venues, and an $11.5 million increase primarily from our other Kentucky HRM venues.
Wagering Services and Solutions
| Fourth Quarter | Years Ended December 31, | ||||||||||
| (in millions) | 2024 | 2023 | 2024 | 2023 | |||||||
| Revenue | $ | 108.0 | $ | 110.6 | $ | 500.7 | $ | 458.4 | |||
| Adjusted EBITDA | 37.3 | 34.9 | 165.6 | 132.1 | |||||||
Fourth Quarter 2024
Fourth quarter 2024 revenue decreased $2.6 million due to a $3.5 million decrease from our sports betting business and a $1.3 million decrease in TwinSpires Horse Racing primarily due to market access and shifts in race days at other tracks. These decreases were partially offset by a $2.2 million increase from Exacta primarily from the growth of our Virginia HRM venues.
Fourth quarter 2024 Adjusted EBITDA increased $2.4 million due to a $2.1 million increase from our Exacta business primarily because of increased fees from the growth of our Virginia HRM venues, a $2.2 million increase from a one-time reduction in compensation expenses related to our Exacta business, and a $0.3 million increase in TwinSpires Horse Racing. These increases were partially offset by a $2.2 million decrease primarily from our sports betting business.
Full Year 2024
Full year 2024 revenue increased $42.3 million due to a $40.8 million increase from our Exacta business primarily from growth in our third party HRM business and from the growth of our Virginia HRM venues and a $2.0 million increase from our sports betting business, partially offset by a $0.5 million decrease from TwinSpires Horse Racing.
Full year 2024 Adjusted EBITDA increased $33.5 million due to a $29.2 million increase from our Exacta business because of increased fees from our Virginia HRM venues, a $2.2 million increase from a one-time reduction in accrued compensation expenses related to our Exacta business, and a $2.6 million increase primarily from our sports betting business, partially offset by a $0.5 million decrease from TwinSpires Horse Racing.
Gaming
| Fourth Quarter | Years Ended December 31, | ||||||||||
| (in millions) | 2024 | 2023 | 2024 | 2023 | |||||||
| Revenue | $ | 257.5 | $ | 230.2 | $ | 1,045.4 | $ | 974.6 | |||
| Adjusted EBITDA | 120.1 | 113.4 | 506.9 | 488.6 | |||||||
Fourth Quarter 2024
Fourth quarter 2024 revenue increased $27.3 million due to a $30.3 million increase from the opening of the Terre Haute Casino Resort, partially offset by a $3.0 million decrease from our other wholly owned gaming properties primarily due to regional gaming softness and increased competition.
Fourth quarter 2024 Adjusted EBITDA increased $6.7 million due to an $11.4 million increase from the opening of the Terre Haute Casino Resort and a $2.7 million increase from our equity investment in Miami Valley Gaming. These increases were partially offset by a $2.3 million decrease from our other wholly owned gaming properties and a $5.1 million decrease from our equity investment in Rivers Des Plaines primarily due to regional gaming softness, increased competition, and higher labor and benefit expense.
Full Year 2024
Full year 2024 revenue increased $70.8 million primarily due to a $96.6 million increase from the opening of the Terre Haute Casino Resort. This increase was partially offset by a $15.6 million decrease from our other wholly owned gaming properties primarily due to inclement weather in January 2024, regional gaming softness, and increased competition; and a $10.2 million decrease due to our decision not to renew the management agreement at Lady Luck at the end of June 2023.
Full year 2024 Adjusted EBITDA increased $18.3 million primarily due to a $44.5 million increase from the opening of the Terre Haute Casino Resort and a $3.0 million increase from our equity investment in Miami Valley Gaming. These increases were partially offset by a $19.5 million decrease from our wholly owned gaming properties and an $8.5 million decrease from our equity investment in Rivers Des Plaines primarily due to inclement weather in January 2024, regional gaming softness, increased competition, and higher labor and benefit expense; and a $1.2 million decrease from proceeds for business interruption insurance claims in the third quarter 2023 that did not reoccur.
All Other
| Fourth Quarter | Years Ended December 31, | ||||||||||||||
| (in millions) | 2024 | 2023 | 2024 | 2023 | |||||||||||
| Revenue | $ | 2.1 | $ | 0.2 | $ | 6.6 | $ | 0.9 | |||||||
| Adjusted EBITDA | (22.4 | ) | (18.1 | ) | (87.9 | ) | (72.2 | ) | |||||||
Fourth Quarter 2024
Fourth quarter 2024 revenue increased $1.9 million due to intercompany revenue related to the captive insurance company that was established in April 2024. All captive revenue is eliminated in consolidation.
Fourth quarter 2024 Adjusted EBITDA decreased $4.3 million driven primarily by increased corporate compensation related expenses and other corporate administrative expenses driven by enterprise growth.
Full Year 2024
Full year 2024 revenue increased $5.7 million primarily due to intercompany revenue related to the captive insurance company that was established in April 2024. All captive revenue is eliminated in consolidation.
Full year 2024 Adjusted EBITDA decreased $15.7 million driven primarily by increased corporate compensation related expenses and other corporate administrative expenses driven by enterprise growth.
| CAPITAL MANAGEMENT |
Share Repurchase Program
The Company repurchased 160,466 shares of its common stock at a total cost of $21.3 million based on trade date under its share repurchase program in the fourth quarter of 2024. The Company repurchased 506,300 shares of its common stock at a total cost of $65.3 million based on trade date under its share repurchase program in 2024. We had $149.6 million of repurchase authority remaining under this program as of December 31, 2024.
Annual Dividend
On October 22, 2024, the Company’s Board of Directors approved an annual cash dividend on the Company’s common stock of $0.409 per outstanding share, a seven percent increase over the prior year. The dividend was paid on January 3, 2025, to shareholders of record as of the close of business on December 6, 2024, with the aggregate cash dividend paid to each shareholder rounded to the nearest whole cent. This marks the fourteenth consecutive year that the Company has increased the dividend per share.
Capital Investments
We currently expect our project capital to be approximately $350 to $400 million in 2025, although this amount may vary significantly based on the timing of work completed, unanticipated delays, and timing of payments to third parties. We plan to use our operating cash flows and existing revolving credit facility to fund our capital project expenditures.
| NET INCOME ATTRIBUTABLE TO CDI |
Fourth Quarter 2024 Results
The Company’s fourth quarter 2024 net income attributable to CDI was $71.7 million compared to $57.6 million in the prior year quarter.
The following factors impacted the comparability of the Company’s fourth quarter 2024 net income to the prior year quarter:
- a $9.9 million after-tax decrease in transaction, pre-opening, and other expense primarily from the settlement of certain liabilities recorded at the time of the Company’s November 2022 acquisition of substantially all of the assets of Peninsula Pacific Entertainment LLC,
- a $1.7 million after-tax increase in other charges and recoveries, net primarily related to non-recurring insurance claim recoveries,
- a $0.2 million decrease of after-tax other charges; and
- a $0.1 million decrease in after-tax non-cash asset impairments.
This was partially offset by:
- a $1.1 million after-tax decrease primarily from legal reserves.
Excluding the items above, fourth quarter 2024 adjusted net income attributable to CDI increased $3.3 million primarily due to the following:
- a $3.9 million after-tax increase primarily driven by the results of our operations,
- partially offset by a $0.6 million after-tax increase in interest expense associated with higher outstanding debt balances and higher interest rates.
Full Year 2024 Results
The Company’s full year 2024 net income attributable to CDI was $426.8 compared to $417.3 million in the prior year.
The following factors impacted comparability of the Company’s net income for the year ended December 31, 2024 compared to the prior year:
- an $86.2 million after-tax gain on the sale of the Arlington property in the prior year; and
- a $0.7 million after-tax decrease primarily from legal reserves.
This was partially offset by:
- a $15.7 million after-tax decrease in non-cash asset impairments,
- a $12.8 million after-tax decrease in transaction, pre-opening, and other expense primarily from the settlement of certain liabilities recorded at the time of the Company’s November 2022 acquisition of substantially all of the assets of Peninsula Pacific Entertainment LLC,
- a $5.1 million after-tax increase of other charges and recoveries, net primarily related to non-recurring insurance claim recoveries; and
- a $1.6 million after-tax decrease of other charges.
Excluding these items, full year 2024 adjusted net income attributable to CDI increased $61.2 million primarily due to the following:
- a $77.0 million after-tax increase primarily driven by the results of our operations and equity income from our unconsolidated affiliates,
- partially offset by a $15.8 million after-tax increase in interest expense associated with higher outstanding debt balances and higher interest rates.
Conference Call
A conference call regarding this news release is scheduled for Thursday, February 20, 2025 at 9 a.m. ET. Investors and other interested parties may listen to the teleconference by accessing the online, real-time webcast and broadcast of the call at churchilldownsincorporated.com/events.cfm, or by registering in advance via teleconference here. Once registration is completed, participants will be provided with a dial-in number containing a personalized conference code to access the call. All participants are encouraged to dial-in 15 minutes prior to the start time. An online replay will be available by noon ET on Thursday, February 20, 2025. A copy of the Company’s news release announcing quarterly results and relevant financial and statistical information about the period will be accessible at churchilldownsincorporated.com.
Use of Non-GAAP Measures
In addition to the results provided in accordance with GAAP, the Company also uses non-GAAP measures, including adjusted net income, adjusted diluted EPS, EBITDA (earnings before interest, taxes, depreciation and amortization), and Adjusted EBITDA.
The Company uses non-GAAP measures as a key performance measure of the results of operations for purposes of evaluating performance internally. These measures facilitate comparison of operating performance between periods and help investors to better understand the operating results of the Company by excluding certain items that may not be indicative of the Company’s core business or operating results. The Company believes the use of these measures enables management and investors to evaluate and compare, from period to period, the Company’s operating performance in a meaningful and consistent manner. The non-GAAP measures are a supplemental measure of our performance that is not required by, or presented in accordance with, GAAP, and should not be considered as an alternative to, or more meaningful than, net income or diluted EPS (as determined in accordance with GAAP) as a measure of our operating results.
We use Adjusted EBITDA to evaluate segment performance, develop strategy, and allocate resources. We utilize the Adjusted EBITDA metric to provide a more accurate measure of our core operating results and enable management and investors to evaluate and compare from period to period our operating performance in a meaningful and consistent manner. Adjusted EBITDA should not be considered as an alternative to operating income as an indicator of performance, as an alternative to cash flows from operating activities as a measure of liquidity, or as an alternative to any other measure provided in accordance with GAAP. Our calculation of Adjusted EBITDA may be different from the calculation used by other companies and, therefore, comparability may be limited.
Adjusted net income and adjusted diluted EPS exclude discontinued operations net income or loss; net income or loss attributable to noncontrolling interest; changes in fair value for interest rate swaps related to Rivers Des Plaines; Rivers Des Plaines’ legal reserves and transaction costs; transaction expense, which includes acquisition and disposition related charges, as well as legal, accounting, and other deal-related expense; pre-opening expense; and certain other gains, charges, recoveries, and expenses.
Adjusted EBITDA includes our portion of EBITDA from our equity investments and the portion of EBITDA attributable to noncontrolling interest.
Adjusted EBITDA excludes:
- Transaction expense, net which includes:
- Acquisition, disposition, and property sale related charges;
- Other transaction expense, including legal, accounting, and other deal-related expense;
- Stock-based compensation expense;
- Asset impairments;
- Gain on property sales;
- Legal reserves;
- Pre-opening expense; and
- Other charges, recoveries, and expenses.
As of December 31, 2021, our property in Arlington Heights, Illinois (“Arlington”) ceased racing and simulcast operations and the property was sold on February 15, 2023 to the Chicago Bears. Arlington’s results and exit costs in 2023 are treated as an adjustment.
For segment reporting, Adjusted EBITDA includes intercompany revenue and expense totals that are eliminated in the Consolidated Statements of Comprehensive Income. See the Reconciliation of Net Income to Adjusted EBITDA included herewith for additional information.
The post Churchill Downs Incorporated Reports 2024 Fourth Quarter and Full Year Results appeared first on Gaming and Gambling Industry in the Americas.


América Latina
BiS SiGMA South America by Softswiss reúne autoridades do esporte, mídia e apostas esportivas
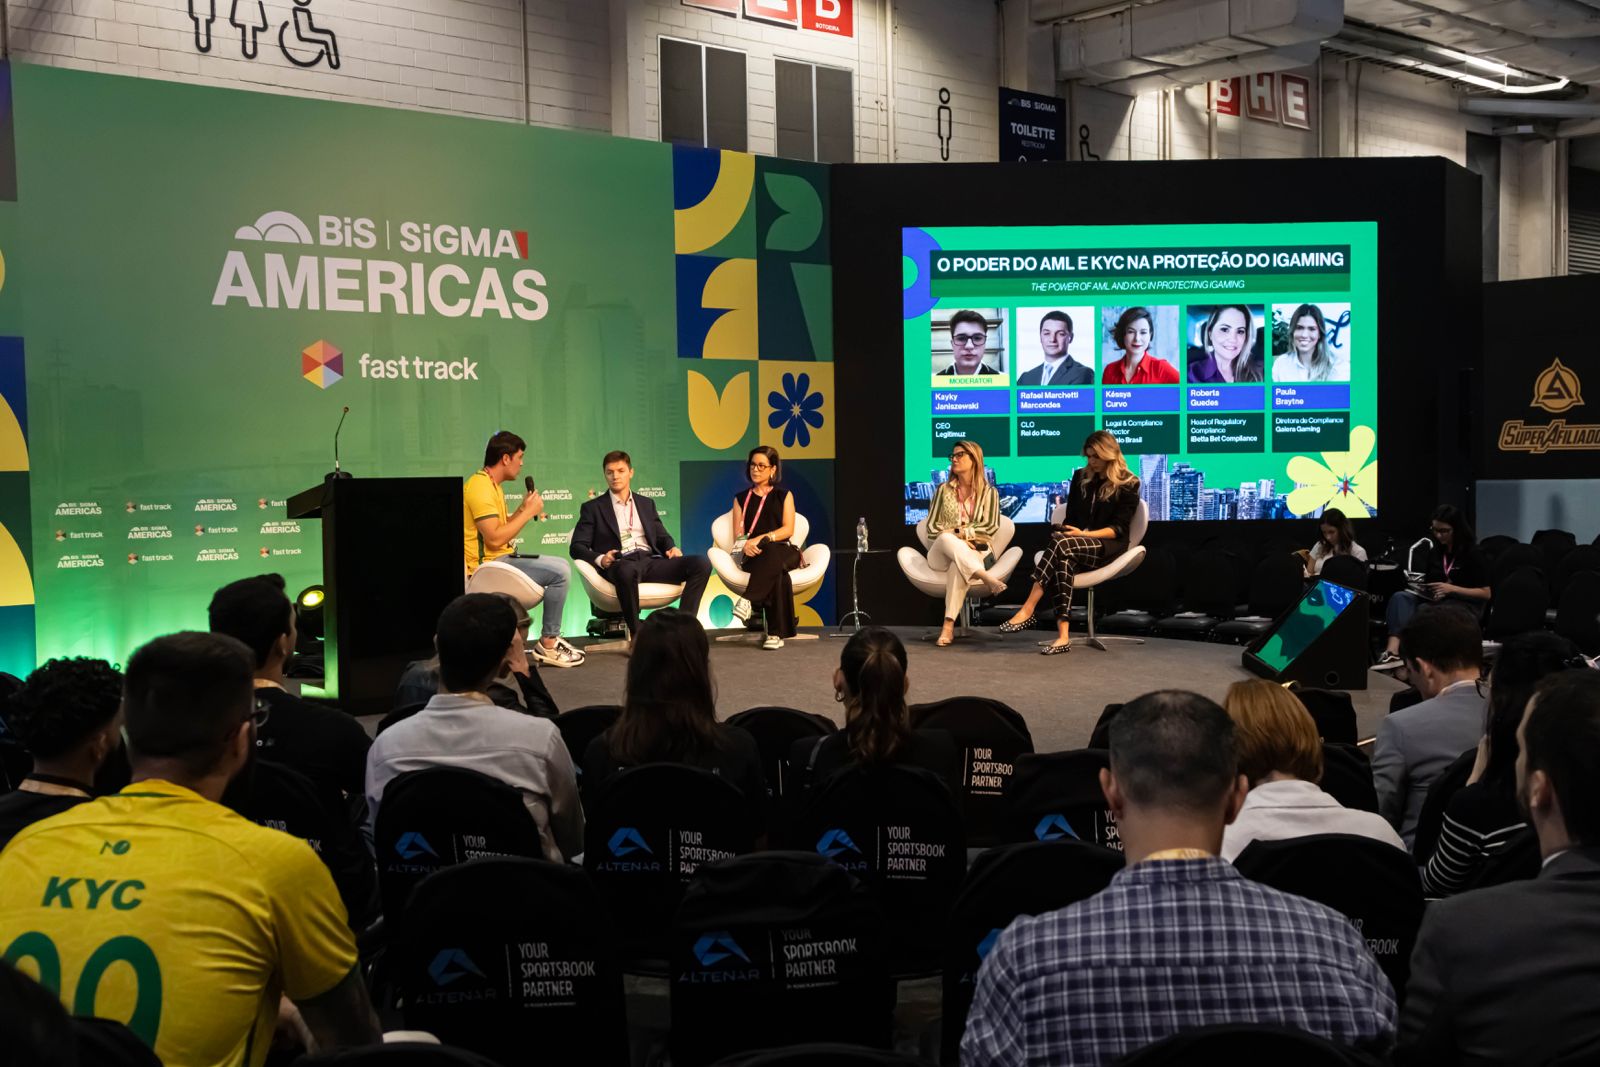
Evento de iGaming traz nomes importantes para discussões do mercado
Entre os dias 07 e 09 de abril, no Expo Transamérica, em cidade de São Paulo será palco do maior evento de iGaming da América Latina, com debates e discussões sobre o setor e sobre como o mercado pode impactar a economia mundial. A Bis SiGMA South America by Softswiss trará autoridades de peso e dará ao publico a oportunidade de conhecer inovações e governança das apostas esportivas.
O setor financeiro já confirmou presença de nomes como Isaac Sidney Menezes Ferreira, presidente da FEBRABAN, Ricardo Silva Siqueira, diretor-presidente da Caixa Loterias e Ricardo Saad, presidente do COAF.
Já no setor de apostas Fabio Macorin, Subcretário da Secretaria de Prêmios e Apostas (SPA) estará presente.
O meio esportivo não ficará de fora, nomes como Michelle Ramalho, vice-presidente da CBF (Confederação Brasileira de Futebol) e Caio Porto Ferreira, delegado e procurador do STJD já estão na lista de autoridades que estarão no evento.
Já relacionados à mídia, Paulo Saad, vice-presidente do Grupo Bandeirantes e Vinicius Lummertz, da Revista Exame e ex-secretário de Turismo.
Os debates acontecerão em três palcos diferentes dentro do evento, com moderadores e especialistas para trazer cada vez mais conhecimento e reconhecimento do mercado para o publico.
Toda agenda pode ser encontrada no site: https://brazilianigamingsummit.com/agenda/
Sobre o BiS SiGMA South America by Softswiss
O BiS SiGMA South America by Softswiss integra o portfólio global de eventos do SiGMA Group, uma das principais plataformas internacionais dedicadas à indústria de jogos, apostas e tecnologia, com edições realizadas em diferentes regiões do mundo.
Realizado anualmente em São Paulo, o BiS SiGMA South America by Softswiss consolidou-se como o maior e mais tradicional evento de negócios do setor de iGaming e apostas da América Latina, reunindo operadores, fornecedores de tecnologia, plataformas, investidores, representantes do poder público e mídia especializada em um ambiente voltado à geração de negócios, troca de conhecimento e desenvolvimento do mercado.
Para a edição de 2026, a expectativa é receber 18.500 participantes, contar com mais de 400 expositores e patrocinadores e uma programação de conteúdo com 250+ palestrantes, reforçando a escala do evento, sua relevância internacional e o papel de São Paulo como principal hub de negócios do setor na região.
Além da feira de negócios, o BiS SiGMA South America by Softswiss oferece uma programação robusta de conteúdo, painéis, workshops e premiações, abordando temas como inovação, operações, tendências de mercado e boas práticas da indústria, contribuindo ativamente para a evolução e profissionalização do ecossistema.
The post BiS SiGMA South America by Softswiss reúne autoridades do esporte, mídia e apostas esportivas appeared first on Americas iGaming & Sports Betting News.

Traffic performance isn’t just about volume or source. What really matters is how well the product turns the first deposit into repeat ones. That’s what drives conversion, retention, repeat deposits, and ultimately LTV — and that’s what defines a partner’s real revenue.
Behind the Game is a series of expert-driven articles where N1 Partners’ gambling affiliate program teams break down what’s happening inside the product and which decisions actually move key metrics.
In this edition, we focus on retention and how it impacts product sustainability and partner earnings.
Why Retention Turns Traffic Into Revenue
Retention is the clearest indicator of whether your traffic matches the actual value of the product. If players don’t come back after their first deposit, the product simply doesn’t convert in the long run.
In Tier-1 GEOs, acquisition costs can reach hundreds of euros. If players don’t make repeat deposits, both the operator and the partner lose.
That’s why success isn’t just about acquisition — it’s about product quality. The N1 Partners portfolio includes high-converting brands with Reg2Dep reaching up to 70% and strong LTV, allowing partners to monetize traffic more efficiently and reach profitability faster.
1. What “Healthy Retention” Looks Like in 2026
In 2026, retention is no longer measured by a single metric. It’s a combination of signals across the entire post-FTD journey.
The key is not just how many players return, but where they drop off.
What key indicators help quickly assess retention quality after FTD?
The core metrics are funnel progression and cohort analysis. Players who move quickly through stages like 1–6 / 1–8 deposits typically form a loyal, active base.
All further communication and retention flows are built to increase transition rates across these stages.
Where does the player journey usually break after the first deposit, and how is it reflected in the data?
The most sensitive point in the FTD funnel is the 1-2 deposit transition. After the first deposit, players start actively testing the product.
At this stage, retention is influenced by several factors: product UX, game variety, overall experience, and withdrawal speed.
All of these pain points are taken into account when building communication flows.
2. Why Retention Drops and What Can Be Fixed Fast
Retention drops are usually caused by mismatched expectations, bonus fatigue, weak personalization, or poor timing in communication.
Some issues can be fixed quickly via CRM and offer adjustments, while others require deeper product-level changes.
What are the top 3 reasons for retention drop across projects? What can be fixed quickly vs. what requires systemic changes?
Retention issues can be divided into three main groups.
Technical and operational issues: payment methods, access to the product, mirrors. These directly impact churn and can usually be fixed quickly. Solutions include alternative payment options, explanatory communication, temporary bonuses, and updated access points.
Product and retention mechanics: weak offers, low engagement. These require revisiting promo strategies, segmentation, and retention flows, and cannot be fixed instantly.
Traffic quality. This is the most complex area, as the issue may lie either in the traffic itself or in how it is processed. It requires behavioral analysis, source comparison, and hypothesis testing across offers, channels, and mechanics. In some cases, this leads to a full revision of the traffic strategy.
What traffic red flags almost always lead to weak retention?
- A high share of players with only one deposit and an untouched balance is a major red flag and often indicates fraud.
- Another common case is bonus hunters. These users exploit welcome offers and then either create duplicate accounts or move on to other brands with the same intent.
3. Reactivation and Bringing Players Back
Reactivation plays a critical role in extending LTV. Players may lose interest, shift habits, or move to other products — but that doesn’t mean they’re gone for good.
What are the key advantages of the reactivation funnel across N1 Partners projects?
The reactivation approach combines team experience with flexible scenarios. Multiple return flows are used, each with different types and values of offers.
Additionally, a system has been implemented to increase engagement after the player returns, which helps grow the share of repeat deposits within this segment.
Another key factor is the speed of identifying players who are about to churn. This is achieved through platform updates, filtering systems, and accumulated behavioral insights.
These elements, combined with a variety of offers and alternative communication channels such as SMS and call centers, make it possible to bring back players who are typically considered “lost.”
4. Mechanics That Actually Retain Players
Retention works best when the product taps into different player motivations: emotion and chance, progress and achievement, status and competition.
What unique features or promos across N1 Partners projects stand out and why do they work for retention?
With deeper analytics, the team gained a better understanding of player behavior and preferences. Promos are now built around real data: favorite games, average bets, and behavioral patterns, making them significantly more effective.
Key mechanics include front-facing features like Bonus Shop and Lucky Spin & Lucky Box. Around 60% of the loyal user base makes at least one purchase in the bonus shop monthly, while over 70% engage with randomizer mechanics.
Puzzle Hunt has also shown strong results, combining randomness with gamification through puzzle collection and a high-value final reward. This mechanic performs especially well among VIP players.
5. Building the Habit: Missions, Calendars, and Loyalty
Strong retention comes from giving players a reason to come back regularly.
Why do missions, calendar-based activities, and loyalty progression drive retention and LTV?
Gamification and FOMO play a key role. Mechanics are designed to drive continuous engagement:
- Earning in-product points
- Daily bonus loops (“come back every day”)
- Loss aversion (miss a day – lose rewards)
Instant reward missions are especially effective. Players complete a task, get rewarded immediately, and return for the next one.
With a younger audience, the “here and now” principle becomes one of the strongest engagement drivers.
6. Loyalty and VIP: Why Progression Beats One-Off Bonuses
Loyalty programs outperform one-time bonuses when players have a clear sense of progression. Levels and checkpoints create momentum and give players a reason to keep coming back.
The key is balance: early levels must feel rewarding and accessible, while higher tiers and VIP rewards should motivate high-value players.
How can you tell if a loyalty program truly drives retention rather than just distributing bonuses?
Effectiveness is measured through impact on behavioral and financial metrics. Key indicators include repeat deposits, ARPU, GGR per player, retention, and churn rate.
It’s also critical to compare program participants with a control group. If participants generate higher revenue and stay active longer, the program is delivering value.
If bonus costs increase without corresponding growth in GGR or LTV, the program is likely just giving away money.
Why Retention Equals Long-Term Revenue
Retention determines whether traffic turns into long-term profit. When done right, the first deposit becomes the start of a cycle of repeat activity — not a one-off event.
If there’s one key criterion for choosing a RevShare brand, what should it be?
Repeat deposit rate. In RevShare models, partner revenue depends on player lifetime. The more often players deposit, the higher the total earnings.
This is exactly why it’s crucial to work with products that already deliver solid performance across key metrics. N1 Partners gambling affiliate program brings together 14+ casino and betting brands across 10+ Tier-1 GEOs, offering competitive scaling conditions — CPA up to €700 for top partners and RevShare up to 45% + NNCO.
A product that consistently retains players and grows LTV delivers stable, long-term revenue — and that’s what makes it worth scaling.
Be number one with N1 Partners

A closer look at the latest slot releases and the mechanics driving the current design direction
The latest wave of slot releases highlights a market that is no longer driven by volume alone, but by structure, retention, and increasingly complex gameplay systems.
Across recent launches, suppliers are leaning into deeper mechanics — from progression layers and expanding grids to bonus-first formats and branded experiences designed for longer player engagement.
Rather than simply introducing new themes, the focus is shifting toward how games evolve and how players interact with features beyond the base spin.
System-Driven Design Takes the Lead
One of the clearest signals comes from Dark Waters III Power Combo: The Cursed Voyage by Games Global in collaboration with Just For The Win®. The title combines a progression meter, expanding grid mechanics, and evolving Free Spins, creating a layered experience that extends beyond traditional session-based play.

Similarly, MONOPOLY MEGAPOTS from Big Time Gaming demonstrates how branded content is evolving. Instead of relying purely on recognition, the game integrates high-density mechanics, scaling multipliers, and multiple feature layers, aligning familiar IP with modern gameplay expectations.

Branded Content Evolves Beyond Recognition
The release of Game of Thrones by Blueprint Gaming further reinforces this shift. Built around a progression-based structure, including a “Seven Kingdoms” map and feature modifiers, the title reflects a broader move toward IP-driven games that offer depth and continuity rather than surface-level branding.

Expanding Core Mechanics
Several releases highlight how established mechanics are being extended rather than replaced.
Candy Links Bonanza 3 by Stakelogic builds on a proven framework by introducing additional layers and enhanced jackpot features.

Ultra Buffalo Hold and Win from Booming Games follows a similar path, expanding the classic Hold and Win model with grid expansion and additional bonus elements.

Meanwhile, Fortune Dragon Joy by Habanero leans into high-volatility gameplay, combining traditional thematic elements with strong multiplier potential and feature carry-over.

Broader Market Activity
Alongside these standout releases, a range of additional titles reflects the industry’s current baseline:
- Wazdan – Magic Fruit$: Oranges
- PG Soft – Mayan Destiny
- GAMOMAT – Frooty Troupe – Game On!
- Pragmatic Play – Jelly Express
- Greentube – Rumble Riches
 Haulin’ Gold
 - BGaming – Sugar Merge Up
- BGaming / Perfect Position – Gates of Power
- RAW iGaming – Fortune Teller’s Charm 6 BONUS RUSH
These releases continue to explore variations of bonus mechanics, thematic diversity, and mobile-first design, reinforcing broader industry trends.
From Games to Systems
Taken together, the latest releases point to a clear transition in slot development.
The focus is shifting from standalone gameplay experiences to structured systems built around retention, where progression, persistence, and feature layering play a central role.
As competition intensifies, differentiation is no longer achieved through theme alone, but through how effectively a game can sustain engagement over time.
The post Weekend Reels: Slot Drops & Trends Shaping the Market appeared first on Eastern European Gaming | Global iGaming & Tech Intelligence Hub.

-

 Africa4 days ago
Virgin Bet goes live in South Africa
-
bingo3 days ago
-
Charity Space Scotland4 days ago
Scottish Government Announces £7.9M Investment to Tackle Gambling Harms
-
ELA Games4 days ago
2026 SiGMA Americas Awards Features ELA Games in Two Major Categories
-
BetMGM4 days ago
PA Gaming Control Board Imposes $100,000 Fine on BetMGM
-
apuestas4 days ago
Brasil 2026: Bets presionan el presupuesto de los hogares y redefinen la competencia por el consumo
-
Betnacional4 days ago
Brazil: Betting pressures household budgets and reshapes the competition for consumer spending
-
Compliance Updates4 days ago
Peter Knutsson Becomes New Director General of Swedish Gambling Authority