Latest News
INTRALOT announces First Quarter 2022 Financial Results

INTRALOT SA (RIC: INLr.AT, Bloomberg: INLOT GA), an international gaming solutions and operations leader, announces its financial results for the three-month period ended March 31st, 2022, prepared in accordance with IFRS.
OVERVIEW
Group Revenue at €97.7m in 1Q22 (+0.1% y-o-y).
EBITDA in 1Q22 at €26.1m (+4.9% y-o-y).
NIATMI (Net Income After Tax and Minority Interest) from continuing operations at €-5.7m, vs.
€-6.9m a year ago.
Greek entities OPEX better by 12.5% y-o-y.
Operating Cash Flow at €17.3m in 1Q22.
Group Net CAPEX in 1Q22 was €4.3m.
Group Cash at the end of 1Q22 at €98.0m.
Net Debt at €500.6m at the end of 1Q22.
Net Debt/ LTM EBITDA at 4.5x in 1Q22.
On April 26, 2022, INTRALOT announced that it will convene a shareholders’ meeting to approve a Share Capital Increase of the Company via a rights issue, up to an amount not exceeding the 150% of the paid-up share capital. The proceeds will be used to purchase the shares in Intralot Inc. currently not controlled by the parent Group. To this end a binding Sale Purchase Agreement has been signed with the minority shareholders controlling 33.2m shares of Intralot Inc. for a price of €3.65 per share, conditional upon successful completion of the Share Capital Increase. INTRALOT announced that it has signed a binding MOU with Standard General Master Fund II L.P., according to which Standard General will purchase all unallocated shares in the Share Capital Increase, up to a number not exceeding one third of the total voting shares of Intralot SA for up to €0.58 per share.
On May 23, 2022, an extraordinary Shareholders’ Meeting provided authorization to the Board of Directors of Intralot SA to determine the terms of the Share Capital Increase and undertake all necessary actions.
Note:
Due to rounding, numbers presented throughout this and other documents may not add up precisely to the totals.
Group Headline Figures
| (in € million) | 1Q22 | 1Q21 | % | LTM | ||
| Change | ||||||
| Revenue (Turnover) | 97.7 | 97.6 | 0.1% | 414.1 | ||
| GGR | 79.8 | 78.9 | 1.2% | 336.2 | ||
| OPEX1 | (21.8) | (22.1) | -1.2% | (101.4) | ||
| EBITDA2 | 26.1 | 24.9 | 4.9% | 111.7 | ||
| EBITDA Margin | 26.7% | 25.5% | + 1.2pps | 27.0% | ||
| (% on Revenue) | ||||||
| EBITDA Margin | 32.7% | 31.6% | + 1.1pps | 33.2% | ||
| (% on GGR) | ||||||
| Capital Structure Optimization | (0.3) | (5.0) | -93.9% | (12.4) | ||
| expenses | ||||||
| D&A | (17.1) | (15.9) | 7.3% | (72.2) | ||
| EBT | (2.3) | (2.8) | 17.5% | 37.6 | ||
| EBT Margin (%) | -2.4% | -2.9% | + 0.5pps | 9.1% | ||
| NIATMI from continuing operations | (5.7) | (6.9) | 17.9% | 27.8 | ||
| Total Assets | 580.5 | 612.1 | – | – | ||
| Gross Debt | 598.6 | 734.3 | – | – | ||
| Net Debt | 500.6 | 643.7 | – | – | ||
| Operating Cash Flow from total | 17.3 | 24.5 | -29.6% | 100.4 | ||
| operations | ||||||
| Net CAPEX | (4.3) | (2.9) | 47.3% | (24.3) | ||
INTRALOT Chairman & CEO Sokratis P. Kokkalis noted:
“First quarter results show a consolidation of gains and recovery from the COVID impact and reflect an improved financial profile, with normalized revenues and a reduction in operational expenses and debt servicing costs consistent with the Company’s business plan. On the background of this strongly improved P/L and Balance Sheet, the Company has designed and is about to launch a Share Capital Increase by means of Rights Issue and has secured the commitment of Standard General Master Fund
- P. as cornerstone investor for the unsubscribed rights in a move that will significantly strengthen our prospects to grasp the tremendous opportunities in the US and the global markets.”
- OPEX line presented excludes the capital structure optimization expenses.
- The Group defines “EBITDA” as “Operating Profit/(Loss) before tax” adjusted for the figures “Profit/(loss) from equity method consolidations”, “Profit/(loss) to net monetary position”, “Exchange Differences”, “Interest and related income”, “Interest and similar expenses”, “Income/(expenses) from participations and investments”, “Write-off and impairment loss of assets”, “Gain/(loss) from assets disposal”, “Reorganization costs” and “Assets’ depreciation and amortization”.
OVERVIEW OF RESULTS
REVENUE
Reported consolidated revenue posted a steady performance compared to 1Q21, leading to total revenue for the three-month period ended March 31st, 2022, of €97.7m (+0.1%).
- Lottery Games was the largest contributor to our top line, comprising 61.9% of our revenue, followed by Sports Betting which contributed 18.8% to Group turnover for the three-month period. Technology contracts accounted for 7.7% and VLTs monitoring represented 11.2% of Group turnover, while Racing constituted the 0.5% of total revenue.
- Reported consolidated revenue for the three-month period is higher only by €0.1m year over year. The main factors behind the steady top line performance per Business Activity are:
- €+1.8m (+6.1%) from our Licensed
Operations (B2C) activity line with the variance driven by:
- Higher revenue in Argentina (€+2.5m or +32.0% y-o-y), driven by local market growth. In local currency, current year results posted a +50.4% y-o-y increase, and
- Lower revenue in Malta (€-0.6m or -2.9% y-o-y), driven by market performance.
- €+0.7m (+1.3%) from our Technology and Support Services (B2B/ B2G) activity line, with the variance driven by:
- Higher revenue in Australia (€+1.1m or +30.6% y-o-y), due to lockdown restrictions in 1Q21,
- Higher revenue in Croatia (€+0.9m), following the go-live of the lottery solution developed for Hrvatska Lutrija (national lottery of Croatia),
- Higher revenue from other jurisdictions (€+0.5m) mainly due to services related sales, and
- Lower revenue in US operations (€-1.9m or -5.1% y-o-y), was primarily affected by the nonrecurrence of the jackpot that boosted 1Q21 sales by c. €4.0m. Revenue from services ended lower by -3.4% y-o-y, while revenue from merchandise sales generated a deficit of -55.4% y-o-y due to their less frequent nature. From a currency perspective, there was a positive impact of 6.9% (Euro depreciation versus a year ago — in average terms).
- €-2.4m (-18.3%) from our
Management (B2B/ B2G) contracts activity line with the variance driven by:
- Slightly higher revenue in Morocco (€+0.1m),
- Marginally higher revenue from our US Sports Betting contracts in Montana and Washington, D.C. (€+0.1m), and
- Lower revenue from our Turkish operations (€-2.6m), solely affected by the appreciation of EUR (+75.8% versus a year ago – in average terms). In local currency, current year results posted a +20.4% y-o-y increase. In 1Q22, the local Sports Betting market expanded close to 1.3 times y-o-y, with the online segment representing close to 89% of the market at the end of 1Q22.
- Constant currency basis: In 1Q22, revenue — net of the negative FX impact of €3.8m —reached €101.4m (+4.0% y-o-y).
GROSS GAMING REVENUE & Payout
- Gross Gaming Revenue (GGR) from continuing operations concluded at €79.8m in 1Q22, posting an increase of 1.2% (or €+0.9m) year over year, attributable to:
- the decrease in the non-payout related GGR (-1.7% y-o-y or €-1.2m vs. 1Q21), driven mainly by the lower top line contribution of our US operations (jackpot affected), followed by
- the increase in the payout related GGR (+20.2% y-o-y or €+2.1m vs. 1Q21), driven mainly by the lower average payout ratio both in Malta and Argentina (+4.3% y-o-y on wagers from licensed operations3). 1Q22 Average Payout Ratio4 decreased by 5.4pps vs. 1Q21 (58.9% vs. 64.4%), significantly affected by the higher weighted contribution from our operations in Malta.
- Constant currency basis: In 1Q22, GGR — net of the negative FX impact of €3.1m — reached €82.9m (+5.1% y-o-y).
- Licensed Operations Revenue also include a small portion of non-Payout related revenue, i.e., value-added services, which totaled €1.3m and €0.8m for 1Q22 and 1Q21respectively.
- Payout ratio calculation excludes the IFRS 15 impact for payments to customers.
OPERATING EXPENSES5 & EBITDA6
- Total Operating Expenses ended lower by €0.3m (or -1.2%) in 1Q22 (€21.8m vs. €22.1m). After excluding the higher D&A expenses (€0.7m) in USA, Morocco and Croatia, Operating Expenses ended lower by €0.9m supported by cost containments in HQ perimeter.
- Other Operating Income from continuing operations ended at €5.7m presenting an increase of 3.2% y-o-y (or €+0.2m). The bulk of income is driven by the equipment leases in the USA.
- EBITDA from continuing operations amounted to €26.1m in 1Q22, posting an increase of 4.9% (or €+1.2m) compared to 1Q21. Despite the absence of jackpot that boosted significantly 1Q21 performance (US operations), the Group has managed to improve its EBITDA via the combined effect of the lower payout from our licensed operations and the lower Operating Expenses.
- On a yearly basis, EBITDA margin on sales improved to 26.7%, compared to 25.5% in 1Q21 (+1.2pps).
- LTM EBITDA stands at €7m.
- Constant currency basis: In 1Q22, EBITDA, net of the negative FX impact of €1.4m, reached €27.5m (+10.5% y-o-y).
EBT / NIATMI
EBT in 1Q22 totaled €-2.3m, compared to €-2.8m in 1Q21, with the variance driven by:
- the lower reorganization expenses following the succesful conclusion of our capital structure optimization process (€+4.7m vs 1Q21),
- the lower interest expenses, direct effect of debt restructuring (€+1.9m vs 1Q21)
- the positive impact from EBITDA (€+1.2m vs 1Q21)
The major headwinds affecting the improved perfornance can be attributed to:
- the negative impact from FX results (€-4.2m vs 1Q21), as a result of the valuation of cash balances in foreign currency other than the functional currency of each entity, the valuation of commercial and borrowing liabilities of various subsidiaries abroad in EUR, as well as the negative effect from the reclassification of FX reserves to Income Statement applying IFRS 10,
- the recognition of expenses vs income from participations and investments (€-1.5m vs 1Q21),
- the higher D&A (€-1.2m vs 1Q21), mainly due to Turkey (Bilyoner) and Morocco
- the accounting loss identified due to IAS 29 in our Argentinian operations (€-1.1m vs 1Q21).
Constant currency basis: In 1Q22 EBΤ, adjusted for the FX impact, reached €-0.4m, from €-6.5m in 1Q21.
- NIATMI from continuing operations in 1Q22 concluded at €-5.7m compared to €-6.9m in 1Q21. NIATMI from total operations in 1Q22 amounted to €-5.7m (improved by €2.6m vs. a year ago), including the performance of the discontinued operations in Peru and Brazil.
- Constant currency basis: NIATMI (total operations) in 1Q22, on a constant currency basis, reached €-5.3m from €-12.1m in 1Q21.
- Operating Expenses analysis excludes expenditures related to capital structure optimization.
- EBITDA analysis excludes Depreciation & Amortization, and expenditures related to capital structure optimization.
CASH-FLOW
- Operating Cash-flow in 1Q22 amounted to €17.3m, lower by €7.3m, compared to 1Q21. Excluding the operating cash-flow contribution of our discontinued operations in Brazil, the cash-flow from operating activities is lower by €7.0m vs. a year ago and is attributed to Income Tax payments vs returns 1Q21.
- Adjusted Free Cash Flow7 in 1Q22 decreased by €2.9m to €1.7m, compared to €4.6m a year ago. The main negative contributors to this variance were the income tax paid vs return in 1Q21 (€-7.4m y-o-y) and the higher maintenance capex (€-1.8m). On positive ground, dividends paid during the period were lower (€+3.1m y-o-y), net finance charges following the capital restructuring generated savings (€+2.0m y-o-y) and EBITDA performance has been improved (€+1.2m y-o-y).
- Net CAPEX in 1Q22 was €4.3m, higher by €1.4m compared to 1Q21. CAPEX in 1Q22 has been allocated towards R&D and project pipeline delivery (€0.3m), US (€3.0m) and the rest of operations (€1.0m). Maintenance CAPEX accounted for €2.2m, or 52.0% of the overall capital expenditure in 1Q22, from €0.8m or 28.2% in 1Q21.
- Net Debt, as of March 31st, 2022, stood at €500.6m, increased by €3.4m compared to December 31st, 2021 (€497.2m). The Net Debt increase was impacted primarily by the normal course of business following an adverse working capital movement, the exchange rate differences
(€+4.7m) for our USD denominated debt, and investments in growth capex (€+1.4m) for our US operations. The increase was partially offset by the lower interest accrued over 1Q22 vs December 2021.
- Calculated as EBITDA – Maintenance CAPEX – Cash Taxes – Net Cash Finance Charges (excluding refinancing charges) – Net Dividends Paid; all finance metrics exclude the impact of discontinued operations.
OUTLOOK
Although the risks associated with the pandemic of COVID-19 have been downgraded, the geopolitical tension arising from the war in Ukraine coupled with the energy crisis, the supply chain disruptions and the rising inflation are factors that are expected to determine the economic outlook over the coming months.
Our Group does not have direct exposure in terms of operations or dependency on suppliers in Ukraine and Russia. However, the risk of indirect effects on the Group’s business activities from the reduction in the household disposable income and the possible increase in operating expenses due to inflationary pressures cannot be overlooked.
The Management of the Company monitors the geopolitical and economic developments on a constant basis and is ready to take all the necessary measures for protecting its operations.
RECENT/ SIGNIFICANT COMPANY DEVELOPMENTS
- On April 26, 2022, INTRALOT announced that it will convene a shareholders’ meeting to approve a Share Capital Increase of the Company via a rights issue, up to an amount not exceeding the 150% of the paid-up share capital. The proceeds will be used to purchase the shares in Intralot Inc. currently not controlled by the parent Group. To this end a binding Sale Purchase Agreement has been signed with the minority shareholders controlling 33,227,256 ordinary shares of Intralot Inc. for a price of €3.65 per share, conditional upon successful completion of the Share Capital Increase. INTRALOT announced that it has signed a binding MOU with Standard General Master Fund II L.P., according to which Standard General will purchase all unallocated shares in the Share Capital Increase, up to a number not exceeding one third of the total voting shares of Intralot SA for up to €0.58 per share.
- On May 23, 2022, an extraordinary Shareholders’ Meeting provided authorization to the Board of Directors of Intralot SA to determine the terms of the Share Capital Increase and undertake all necessary actions.
APPENDIX
Performance per Business Segment8
YTD Performance
Performance per Geography
Revenue Breakdown
| (in € million) | 1Q22 | 1Q21 | % | ||
| Change | |||||
| Europe | 35.8 | 34.4 | 4.0% | ||
| Americas | 52.3 | 50.5 | 3.4% | ||
| Other | 15.3 | 16.8 | -8.9% | ||
| Eliminations | (5.7) | (4.2) | – | ||
| Total Consolidated Sales | 97.7 | 97.6 | 0.1% |
Gross Profit Breakdown
| (in € million) | 1Q22 | 1Q21 | % | ||
| Change | |||||
| Europe | 3.5 | (1.7) | – | ||
| Americas | 11.4 | 13.8 | -17.5% | ||
| Other | 13.0 | 14.2 | -8.4% | ||
| Eliminations | (2.7) | (0.7) | – | ||
| Total Consolidated Gross Profit | 25.2 | 25.6 | -1.6% |
- Part of the US revenue that concerns SB management, has been included under the category “Game Management”. The rest of the US revenue is included under the “Technology” business segment.
| Gross Margin Breakdown | ||||||
| % | ||||||
| 1Q22 | 1Q21 | |||||
| Change | ||||||
| Europe | 9.8% | -5.1% | + 14.8pps | |||
| Americas | 21.8% | 27.4% | – 5.5pps | |||
| Other | 84.8% | 84.4% | + 0.4pps | |||
| Total Consolidated Gross Margin | 25.8% | 26.2% | – 0.4pps | |||
INTRALOT Parent Company results
- Revenue for the period increased by 28.1%, to €6.0m, with the improvement driven by the higher rendering of services towards the Group’s subsidiaries in the current period.
- EBITDA shaped at €-1.3m from €-4.5m in 1Q21, with the positive variance stemming from the top-line improvement that generated higher profitability due to better margins and lower costs.
- Earnings after Taxes (EAT) at €-6.7m from €-0.1m in 1Q21, impacted mainly by the gain recorded in 1Q21 following the sale of Intralot de Peru.
| (in € million) | 1Q22 | 1Q21 | % | ||
| Change | |||||
| Revenue | 6.0 | 4.6 | 28.1% | ||
| Gross Profit | (0.5) | (3.1) | -82.9% | ||
| Other Operating Income9 | 0.1 | 0.0 | – | ||
| OPEX9 | (4.5) | (5.1) | -11.8% | ||
| EBITDA9 | (1.3) | (4.5) | 71.5% | ||
| EAT | (6.7) | (0.1) | – | ||
| CAPEX (paid) | (0.3) | (0.5) | -35.4% |
- Other Operating Income, Operating Expenses and EBITDA lines presented exclude the expenditures and recharges related to capital structure optimization.
CONFERENCE CALL INVITATION – 1Q22 FINANCIAL RESULTS
Sokratis Kokkalis – Chairman & CEO, Chrysostomos Sfatos – Deputy Group CEO, Nikolaos Nikolakopoulos – Deputy Group CEO, Fotis Konstantellos – Deputy Group CEO, Andreas Chrysos – Group CFO, Nikolaos Pavlakis – Group Tax & Accounting Director, Antonis Skiadas – Group Finance, Controlling & Budgeting Director and Michail Tsagalakis – Capital Markets Director, will address INTRALOT’s analysts and institutional investors to present the Company’s 1Q22 results, as well as to discuss the latest developments at the Company.
Powered by WPeMatico

Nordic gaming operator Paf is taking another decisive step toward responsible gambling by lowering its mandatory annual loss limit for all customers from €16,000 to €15,000. The move is part of a long-term strategy focused on sustainability, player protection, and ethical revenue growth.
With this latest reduction, Paf has now cut its original loss limit—first introduced in 2018 at €30,000—by 50%. The mandatory cap applies across all gaming categories and to every platform operated by the company.
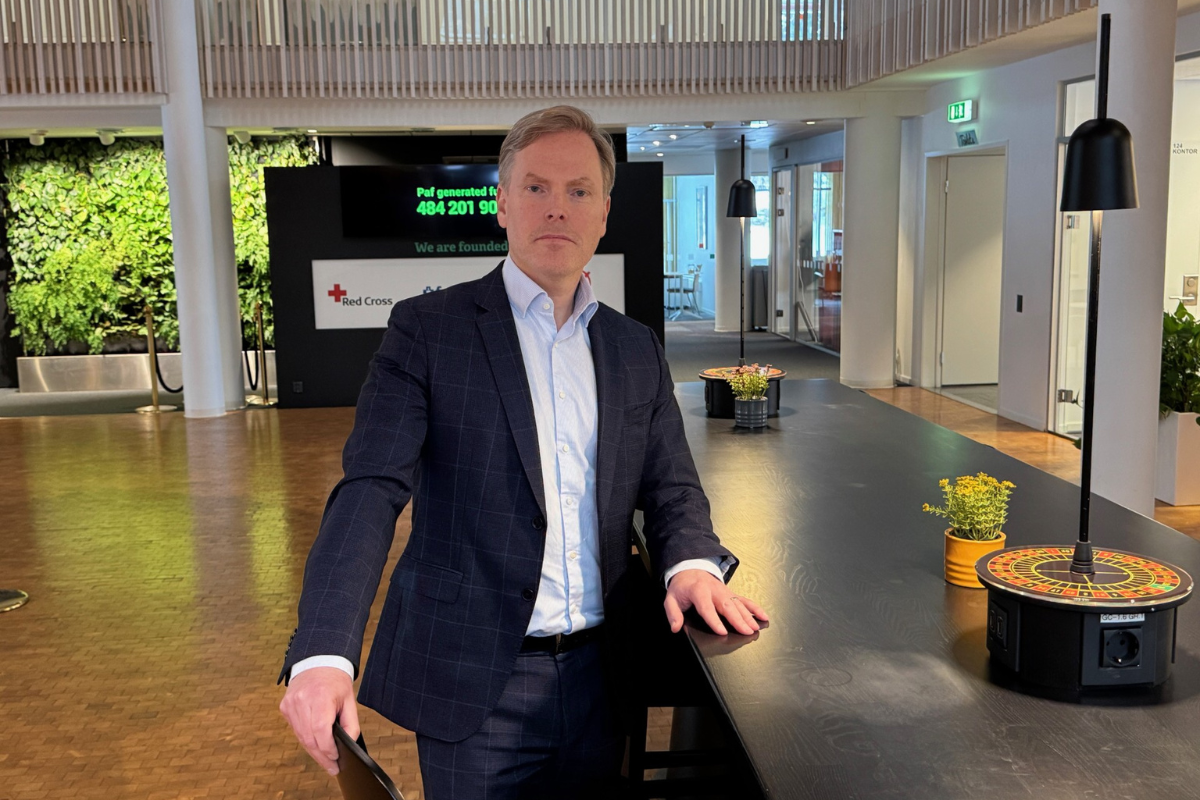
“We are extremely proud that through concrete actions and long-term investments in responsible gaming, we have now halved the first loss limit we introduced in 2018,” said Christer Fahlstedt, CEO of Paf. “It clearly demonstrates that we are serious about our ambition to be a sustainable entertainment company.”
Long-term ambition: €8,000 annual loss limit
The new €15,000 threshold represents another step toward Paf’s previously stated long-term goal of lowering the annual loss limit to €8,000 per player.
“We have been transparent about our ambition to lead the development toward a healthier gaming market,” Fahlstedt added. “Unlike many operators, we are prepared to say no to revenue that comes from unsustainable gaming. However, this transition must happen gradually to ensure long-term stability in a highly competitive market.”
High-intensity player segments phased out
As part of the reduction, Paf will continue to reshape its customer segmentation model. Revenue from the so-called orange segment—players with annual losses between €15,000 and €30,000—will be phased out entirely over time.
Paf has already eliminated revenue from its red segment, which previously consisted of customers losing more than €30,000 annually. The latest changes further reinforce the company’s shift away from high-intensity gambling behavior toward more sustainable play levels.
“Removing the orange segment is a deliberate and important decision,” said Daniela Johansson, Deputy CEO and Chief Responsibility Officer at Paf. “It clearly signals that we do not want revenue that isn’t sustainable over time—especially when our mission is to create long-term benefits for society.”
Call for shared limits across the industry
In addition to mandatory loss limits, Paf customers can set their own voluntary lower limits. While these safeguards have proven effective in curbing harmful behavior, Paf emphasizes that broader industry action is needed.
“Loss limits have a real and measurable impact on player behavior and can stop problems before they escalate,” Fahlstedt said. “But customers can easily switch operators. That’s why common national deposit limits are essential, and why unlicensed gambling must be addressed.”
Paf was the first international gaming operator to introduce mandatory loss limits, and the company continues to advocate for stronger, shared responsibility standards across regulated markets.
The post Paf has halved its loss limit since 2018 appeared first on Eastern European Gaming | Global iGaming & Tech Intelligence Hub.

Competitive entertainment company BLAST has announced a new partnership with Polymarket, the world’s largest prediction market, naming the platform its ‘Official Prediction Partner’ throughout 2026. The collaboration will span BLAST’s Counter-Strike and Dota 2 tournament properties, BLAST Premier and BLAST Slam, bringing prediction-driven engagement to fans across multiple global tournaments.
Polymarket will be integrated across seven of BLAST’s global Counter-Strike 2 and Dota 2 events, beginning this week at BLAST Slam VI in Malta. Both Dota and Counter-Strike events will also feature bespoke content pieces used in broadcast as well as desk segments highlighting the platform’s integration into BLAST’s events.
Polymarket will receive prominent visibility across live broadcasts, arena events and digital content, as BLAST continues to expand how fans engage with top-tier competitive entertainment. Polymarket branding will be featured consistently across BLAST’s broadcasts via digital integrations and physical prints.
Beyond broadcast, the partnership extends into live arena events, where Polymarket will be incorporated into the on-site fan experience through features such as the Polymarket Fancam as well as the ability to host creators and streamers within the arena via dedicated event streaming booths.
Alexander Lewin, SVP of Commercial Revenue at BLAST said: “Esports is evolving rapidly into a more interactive, data-driven entertainment experience, and we are delighted to team up with Polymarket to bring exciting new engagement opportunities to our fans all around the world. Together, we’re creating something that feels native to esports culture: fast, live, and deeply connected to the action. This partnership is about enhancing how fans experience competition, whether they’re watching online or inside an arena. We’re proud to join Polymarket’s industry-leading group of partners, alongside the NHL, UFC and the MLS among others, reflecting the growing global recognition of BLAST’s events.”
Matthew Modabber, CMO of Polymarket, said: “Esports has long been dominated by traditional sportsbooks, but prediction markets open the door to a more transparent and community-driven way for fans to engage with competition. Partnering with BLAST brings that experience to a global audience and helps make prediction markets a natural part of how people watch, debate, and follow competitive gaming. We see this as the beginning of a new chapter for fan participation in esports.”
The BLAST Premier 2026 calendar includes taking Counter-Strike to global destinations, including Rotterdam, Fort Worth and Hong Kong, alongside the continuation of the BLAST Slam circuit. BLAST’s next event is the BLAST Slam VI in Malta (3rd-15th February), with 12 of Dota’s best teams battling at the largest fixed studio in Malta.
The post BLAST Names Polymarket Official Prediction Partner for BLAST Premier and BLAST Slam in 2026 appeared first on Americas iGaming & Sports Betting News.

Gamblers Connect, the acclaimed iGaming media and affiliate platform, is excited to reveal a new strategic partnership with NeverEnding Tech, the “anti-bureaucracy” iGaming content creator that is quickly transforming the video slots industry.
This collaboration unites two entities dedicated to transparency, quick execution, and a mutual goal of advancing the industry through genuine relationships and top-quality content. In an industry frequently hindered by excessive bureaucracy and repetitive communication, NeverEnding has swiftly positioned itself as a nimble alternative—providing rapid decision-making, focused strategy, and performance-oriented results that appeal to current operators.
Gamblers Connect focuses on allies that provide true advantages and a distinct unique selling proposition. NeverEnding’s philosophy of “Games, Growth, and No Excuses” closely matches the company’s mission: providing dependable, high-quality industry insights without any unnecessary details.
This partnership focuses on incorporating NeverEnding’s dynamic portfolio, featuring popular titles such as Ultimate Hot Coins: Hold & Win and Coin Blast Extra, into the Gamblers Connect ecosystem, providing its community with direct access to today’s most effective and captivating slots.
Gjorgje Ristikj, Founder of Gamblers Connect, said: “As we integrate NeverEnding into our platform, players and operators alike can expect a streamlined flow of information regarding their latest releases and technical innovations. NeverEnding’s unique “B2B Backed by B2C Power” model ensures that our partnership isn’t just about visibility; it’s about generating real traction for the games that matter. Together, we are setting a new standard for how content providers and media hubs collaborate: with speed, transparency, and a relentless focus on the future of gaming.”
Ihor Zarechnyi, representing the leadership at NeverEnding, highlighted the importance of this synergy: “Gamblers Connect brings together the people who actually move this industry forward. For NeverEnding, this collaboration is about being present where real conversations happen, exchanging experience, and building partnerships that go beyond logos and announcements.”
The post NeverEnding Partners with Gamblers Connect to Expand Services appeared first on Eastern European Gaming | Global iGaming & Tech Intelligence Hub.

-

 BMM Innovation Group7 days ago
BMM Testlabs Secures Minas Gerais License, Expanding iGaming and Sports Betting Certification in Brazil
-
Latest News7 days ago
BMM TESTLABS GRANTED NEW LICENSE IN BRAZILIAN STATE OF MINAS GERAIS, EXPANDING ITS PRODUCT TESTING AND CERTIFICATION FOOTPRINT IN BRAZIL
-
Brasil on Track5 days ago
ODDSGATE LAUNCHES “BRASIL ON TRACK”, A STRATEGIC PLATFORM FOR NAVIGATING BRAZIL’S REGULATED IGAMING MARKET
-
Latest News6 days ago
Million Games Unveils Looting Raccoons: A Charming Pirate Slot Packed with Features
-
3 Oaks Gaming6 days ago
Strategic partnership sees 3 Oaks Gaming expand its LatAm footprint with one of Mexico’s fastest-growing operators
-
0005 days ago
Cash Pig 2 Debuts from Booming Games with 15,000 Top Prize
-
40 Glossy Hot5 days ago
Amusnet Releases “40 Glossy Hot”
-
Compliance Updates6 days ago
Romanian National Gambling Authority Pushes for Urgent Overhaul of Self-exclusion Rules