Canada
Gambling.com Group Reports 2021 Financial Results
Gambling.com Group Limited, a leading provider of digital marketing services for the global online gambling industry, today announced its operating and financial results for the year and the fourth quarter ended December 31, 2021.
2021 Financial Highlights
- North American revenue grew 89% to $7.5 million compared to $4.0 million for the prior year
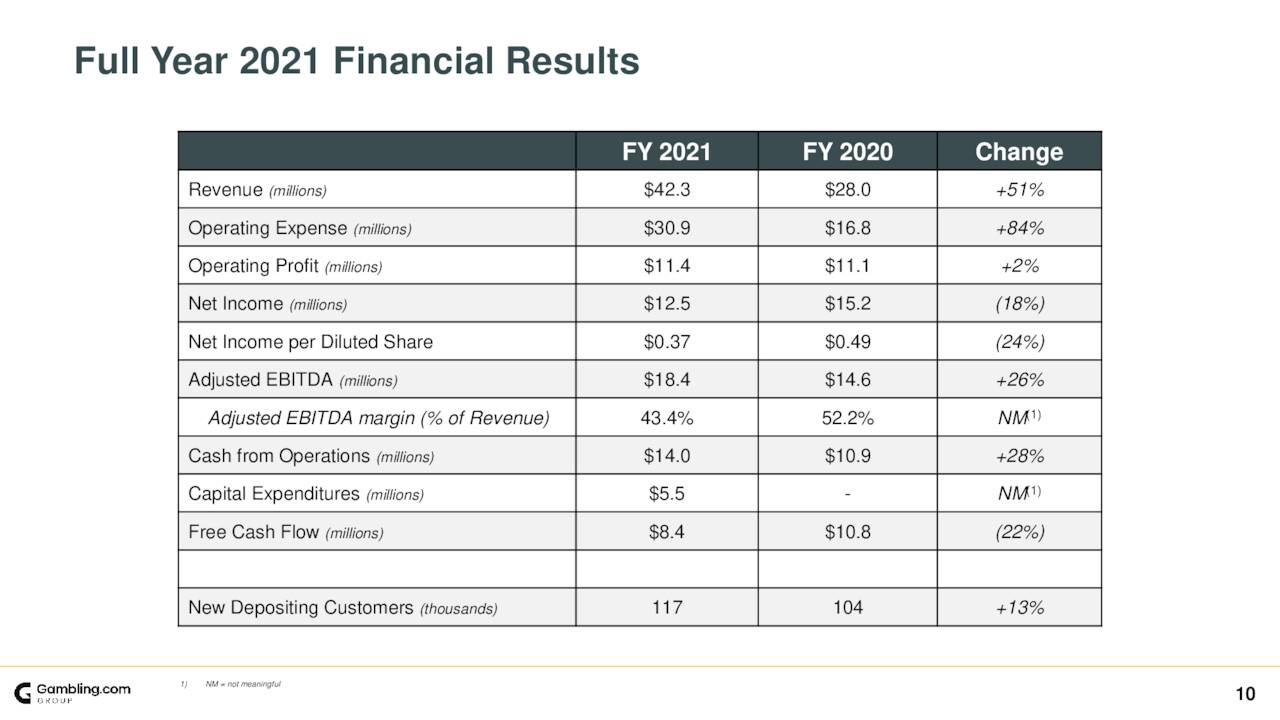
- Revenue of $42.3 million grew 51% compared to $28.0 million for the prior year
- Net income of $12.5 million, or $0.37 per diluted share, compared to a net income of $15.2 million, or $0.49 per diluted share, for the prior year
- Adjusted EBITDA of $18.4 million increased 26% compared to $14.6 million for the prior year, representing an Adjusted EBITDA margin of 43%1
- Free cash flow of $8.4 million decreased 22% compared to $10.8 million for the prior year1
Fourth Quarter 2021 Financial Highlights
- North American revenue grew 56% to $2.2 million compared to $1.4 million in the same period for the prior year
- Revenue of $10.3 million remained consistent to $10.3 million in the same period for the prior year
- Net income of $0.9 million, or $0.02 per diluted share, compared to a net income of $8.5 million, or $0.35 per diluted share, in the same period for the prior year
- Adjusted EBITDA of $2.3 million decreased 63% compared to $6.1 million in the same period for the prior year, representing an Adjusted EBITDA margin of 22%1
- Free cash flow of $(1.8 million) compared to $3.5 million for the prior year1
Business Highlights
- Completed successful public listing of ordinary shares on the Nasdaq Global Market in July 2021 under the ticker symbol “GAMB”
- Named the 2021 EGR Affiliate of the Year and 2021 SBC North America Casino Affiliate of the Year
- Delivered 117,000 new depositing customers in 2021 compared to 104,000 in 2020
- Launched several new U.S.- facing websites during 2021 and acquired an incredibly strong portfolio of U.S. specific domain names
- Announced the acquisition of RotoWire.com – a leader in U.S online fantasy sports – in December 2021 to leverage RotoWire’s high-quality traffic and drive substantial incremental sports betting affiliate revenue in the U.S., the acquisition was completed on January 1, 2022
- Announced media partnership with McClatchy in January 2022 to monetize the McClatchy portfolio of digital media assets through sports betting in 29 markets across 14 states
- Successfully entered the New York and Louisiana markets in January 2022
- Announced acquisition of BonusFinder.com in February 2022 to better position the Group for the upcoming market launch in Ontario and further strengthening the Group’s North American presence
“We grew our revenue in 2021 by 51% compared to the prior year, delivered an EBITDA margin of 43% and generated over $8 million of free cash flow as many other industry players struggled to find a path to sustainable profitability,” said Charles Gillespie, Chief Executive Officer and Co-founder of Gambling.com Group. “As we look towards 2022, we are encouraged by the strongest start to a year we have seen in our 15-year history. Helped by launches in New York and Louisiana, January was our best-single month performance ever – even before consolidating financial results from our recent acquisitions. Just in January, we have seen the total addressable market in North America expand by leaps and bounds and there is a clear path to additional state launches this year, along with the impending launch of Ontario next month. As B2C operators in the U.S. seek a path to sustainable profitability and evaluate their marketing spend going forward, we believe that the affiliate model is ideally positioned to provide operators with more effective, higher ROI investments where they can clearly attribute the source, profitability and lifetime value of a referred player. We view this shift as greatly benefitting the value of our performance marketing revenue model, and we are confident that these tailwinds support what we expect to be another year of record performance for the Group.”
2022 Outlook
Based on currently available information, the Group estimates that, for the full year 2022:
- Total revenue will be in the range of $71 million and $76 million; and
- Adjusted EBITDA will be in the range $22 million and $27 million1
Elias Mark, Chief Financial Officer of Gambling.com Group, added, “Our expectation for another year of record revenue and Adjusted EBITDA is supported primarily by our premier domain portfolio and our growing presence in the U.S. achieved through continuous investments in U.S-facing assets. Organic growth in North America is complemented by our recent acquisitions of RotoWire.com and BonusFinder.com as well as our initiatives to further our leadership in the more established markets that we currently serve. As we have stated, our Adjusted EBITDA margin may deviate from target in the short-term as we strategically invest to strengthen our U.S. footprint, which is reflected in our 2022 outlook. Nonetheless, our profitability metrics remain among the very best in the industry, and our free cash flow generation more than covers our organic growth initiatives and the acquisition of domain names and other assets. We entered 2022 on strong financial footing and are off to the best start to a year in the Company history led by strong growth in North America. We grew total revenue profitably by 51% in 2021 and we look forward to accelerate that rate of profitable growth in 2022.”
|
2021 – 2023 Financial Targets |
||
|
|
|
|
|
Total Revenue Growth |
|
> Average 40% |
|
Adjusted EBITDA Margin1 |
|
> Average 40% |
|
Leverage2 |
|
< Net Debt to Adjusted EBITDA 2.5x3 |
1 Adjusted figures represent non-IFRS information. See “Non-IFRS Financial Measures” and the tables at the end of this release for an explanation of the adjustments and reconciliations to the comparable IFRS numbers.
2 Leverage is defined as Net Debt as a proportion of Adjusted EBITDA.
3 Net Debt is defined as Borrowings less Cash and Cash Equivalents.
|
2021 vs. 2020 Financial Highlights |
||||||||||||||||
|
|
|
YEAR ENDED |
|
|
CHANGE |
|
||||||||||
|
|
|
2021 |
|
|
2020 |
|
|
$ |
|
|
% |
|
||||
|
|
|
(in thousands USD, except for |
|
|
|
|
|
|
|
|||||||
|
CONSOLIDATED STATEMENTS OF |
|
|||||||||||||||
|
Revenue |
|
|
42,323 |
|
|
|
27,980 |
|
|
|
14,343 |
|
|
|
51 |
% |
|
Operating expenses |
|
|
(30,931 |
) |
|
|
(16,849 |
) |
|
|
(14,082 |
) |
|
|
84 |
% |
|
Operating profit |
|
|
11,392 |
|
|
|
11,131 |
|
|
|
261 |
|
|
|
2 |
% |
|
Income before tax |
|
|
12,164 |
|
|
|
10,752 |
|
|
|
1,412 |
|
|
|
13 |
% |
|
Net income for the period attributable to the |
|
|
12,453 |
|
|
|
15,151 |
|
|
|
(2,698 |
) |
|
|
(18 |
)% |
|
Net income per share attributable to ordinary |
|
|
0.40 |
|
|
|
0.55 |
|
|
|
(0.15 |
) |
|
|
(27 |
)% |
|
Net income per share attributable to ordinary |
|
|
0.37 |
|
|
|
0.49 |
|
|
|
(0.12 |
) |
|
|
(24 |
)% |
|
|
|
YEAR ENDED |
|
|
CHANGE |
|
||||||||||
|
|
|
2021 |
|
|
2020 |
|
|
$ |
|
|
% |
|
||||
|
|
|
(in thousands USD, except Adjusted EBITDA Margin, unaudited) |
|
|
|
|
|
|
|
|||||||
|
NON-IFRS FINANCIAL MEASURES |
|
|
|
|
|
|
|
|
|
|
|
|
||||
|
Adjusted EBITDA |
|
|
18,356 |
|
|
|
14,608 |
|
|
|
3,748 |
|
|
|
26 |
% |
|
Adjusted EBITDA Margin |
|
|
43 |
% |
|
|
52 |
% |
|
n/m |
|
|
n/m |
|
||
|
Free Cash Flow |
|
|
8,423 |
|
|
|
10,804 |
|
|
|
(2,381 |
) |
|
|
(22 |
)% |
n/m = not meaningful
|
|
|
YEAR ENDED |
|
|
CHANGE |
|
||||||||||
|
|
|
2021 |
|
|
2020 |
|
|
Amount |
|
|
% |
|
||||
|
|
|
(in thousands, unaudited) |
|
|
|
|
|
|
|
|||||||
|
OTHER SUPPLEMENTAL DATA |
|
|
|
|
|
|
|
|
|
|
|
|
||||
|
New Depositing Customers (1) |
|
|
117 |
|
|
|
104 |
|
|
|
13 |
|
|
|
13 |
% |
- We define New Depositing Customers, or NDCs, as unique referral of a player from our system to one of our customers that satisfied an agreed metric (typically making a deposit above a minimum threshold) with the customer, thereby triggering the right to a commission for us.
Revenue
Total revenue increased 51% to $42.3 million for the year ended December 31, 2021 compared to $28.0 million for the prior year. On a constant currency basis, revenue increased $13.4 million, or 46%. Revenue growth was organic. The increase was driven by both growth in NDCs and improved monetization of NDCs that we attribute to a combination of technology improvements and changes in product and market mix. NDCs increased 13% to 117,000 compared to 104,000 in the prior year.
Our revenue disaggregated by market is as follows:
|
|
|
YEAR ENDED |
|
|
CHANGE |
|
||||||||||
|
|
|
2021 |
|
|
2020 |
|
|
$ |
|
|
% |
|
||||
|
|
|
(in thousands USD) |
|
|
|
|
|
|
|
|||||||
|
U.K. and Ireland |
|
|
21,391 |
|
|
|
16,189 |
|
|
|
5,202 |
|
|
|
32 |
% |
|
Other Europe |
|
|
10,800 |
|
|
|
5,252 |
|
|
|
5,548 |
|
|
|
106 |
% |
|
North America |
|
|
7,484 |
|
|
|
3,959 |
|
|
|
3,525 |
|
|
|
89 |
% |
|
Rest of the world |
|
|
2,648 |
|
|
|
2,580 |
|
|
|
68 |
|
|
|
3 |
% |
|
Total revenues |
|
|
42,323 |
|
|
|
27,980 |
|
|
|
14,343 |
|
|
|
51 |
% |
Revenue increases were primarily driven by growth in revenue from the U.K. and Ireland, Other Europe, and North America.
Our revenue disaggregated by monetization is as follows:
|
|
|
YEAR ENDED |
|
|
CHANGE |
|
||||||||||
|
|
|
2021 |
|
|
2020 |
|
|
$ |
|
|
% |
|
||||
|
|
|
(in thousands USD) |
|
|
|
|
|
|
|
|||||||
|
Hybrid commission |
|
|
15,616 |
|
|
|
14,738 |
|
|
|
878 |
|
|
|
6 |
% |
|
Revenue share commission |
|
|
3,596 |
|
|
|
3,308 |
|
|
|
288 |
|
|
|
9 |
% |
|
CPA commission |
|
|
18,591 |
|
|
|
9,047 |
|
|
|
9,544 |
|
|
|
105 |
% |
|
Other revenue |
|
|
4,520 |
|
|
|
887 |
|
|
|
3,633 |
|
|
|
410 |
% |
|
Total revenues |
|
|
42,323 |
|
|
|
27,980 |
|
|
|
14,343 |
|
|
|
51 |
% |
Revenue increases were driven primarily by additional Cost Per Acquisition, or CPA, commission and Other revenue. The increase in Other revenue was driven by bonuses related to achieving certain operator NDC performance targets and fixed fees.
Our revenue disaggregated by product type from which it is derived is as follows:
|
|
|
YEAR ENDED |
|
|
CHANGE |
|
||||||||||
|
|
|
2021 |
|
|
2020 |
|
|
$ |
|
|
% |
|
||||
|
|
|
(in thousands USD) |
|
|
|
|
|
|
|
|||||||
|
Casino |
|
|
35,632 |
|
|
|
24,135 |
|
|
|
11,497 |
|
|
|
48 |
% |
|
Sports |
|
|
6,188 |
|
|
|
3,210 |
|
|
|
2,978 |
|
|
|
93 |
% |
|
Other |
|
|
503 |
|
|
|
635 |
|
|
|
(132 |
) |
|
|
(21 |
)% |
|
Total revenues |
|
|
42,323 |
|
|
|
27,980 |
|
|
|
14,343 |
|
|
|
51 |
% |
Revenue increases were driven by growth in revenue from casino and sports products.
Operating Expenses
|
|
|
YEAR ENDED |
|
|
CHANGE |
|
||||||||||
|
|
|
2021 |
|
|
2020 |
|
|
$ |
|
|
% |
|
||||
|
|
|
(in thousands USD) |
|
|
|
|
|
|
|
|||||||
|
Sales and marketing expenses |
|
|
14,067 |
|
|
|
8,103 |
|
|
|
5,964 |
|
|
|
74 |
% |
|
Technology expenses |
|
|
3,947 |
|
|
|
2,503 |
|
|
|
1,444 |
|
|
|
58 |
% |
|
General and administrative expenses |
|
|
13,014 |
|
|
|
5,956 |
|
|
|
7,058 |
|
|
|
119 |
% |
|
Movements in credit losses allowance and write offs |
|
|
(97 |
) |
|
|
287 |
|
|
|
(384 |
) |
|
|
(134 |
)% |
|
Total operating expenses |
|
|
30,931 |
|
|
|
16,849 |
|
|
|
14,082 |
|
|
|
84 |
% |
Total operating expenses increased by $14.1 million to $30.9 million compared to $16.8 million in the prior year. On a constant currency basis, operating expenses increased by $13.5 million, or 77%. The increase was driven primarily by increased headcount across Sales and Marketing, Technology, and General and Administrative functions as we invest in the Company’s organic growth initiatives as well as increased administrative expenses associated with operating as a public company.
Sales and Marketing expenses totaled $14.1 million compared to $8.1 million in the prior year. The increase was driven primarily by increased wages and salary expenses associated with increased headcount.
Technology expenses totaled $4.0 million compared to $2.5 million in the prior year. The increase was driven primarily by increased wages and salary expenses associated with increased headcount partially offset by capitalized development costs.
General and Administrative expenses totaled $13.0 million compared to $6.0 million in the prior year. The increase was driven primarily by increased wages and salary expenses associated with increased headcount, professional services, and insurance expenses.
Earnings
Adjusted EBITDA increased by 26% to $18.4 million compared to $14.6 million in the prior year representing an Adjusted EBITDA margin of 43%. The increase was driven primarily by increased revenue partly offset by increased operating expenses.
Operating profit remained relatively constant at $11.4 million compared to $11.1 million in 2020. Operating profit in 2021 was affected by non-recurring costs related to the public offering and future acquisitions by $2.6 million, and share based payments costs by $ 2.0 million ($0.7 million and $0.4 million, respectively, in 2020).
Net income totaled $12.5 million, or $0.37 per diluted share, compared to net income of $15.2 million, or $0.49 per diluted share, in the prior year. Net income in 2020 was positively affected by the recognition of deferred tax assets of $5.4 million and gain from bonds’ redemption of $1.4 million ($1.8 million and zero, respectively, in 2021).
Free Cash-flow
Total cash generated from operations of $14.0 million increased 28% compared to $10.9 million in the prior year. The increase was driven primarily by increased adjusted EBITDA. Free cash flow totaled $8.4 million compared to $10.8 million in the prior year. The decline was the result of increased cash flow generated from operations offset by increased capital expenditures consisting primarily of the acquisition of domain names and capitalized development costs.
|
Balance Sheet |
||||||||||||||||
|
|
|
AS OF |
|
|
CHANGE |
|
||||||||||
|
|
|
2021 |
|
|
2020 |
|
|
$ |
|
|
% |
|
||||
|
|
|
|
|
|
|
|
|
|
|
|
|
|
||||
|
|
|
(in thousands, USD) |
|
|
|
|
|
|
|
|||||||
|
CONSOLIDATED STATEMENTS OF FINANCIAL |
|
|
|
|
|
|
|
|
|
|
|
|
||||
|
Cash and cash equivalents |
|
|
51,047 |
|
|
|
8,225 |
|
|
|
42,822 |
|
|
|
521 |
% |
|
Working capital (2) |
|
|
46,714 |
|
|
|
10,059 |
|
|
|
36,655 |
|
|
|
364 |
% |
|
Total assets |
|
|
91,025 |
|
|
|
45,383 |
|
|
|
45,642 |
|
|
|
101 |
% |
|
Total borrowings |
|
|
5,944 |
|
|
|
5,960 |
|
|
|
(16 |
) |
|
|
(0 |
)% |
|
Total liabilities |
|
|
11,116 |
|
|
|
11,171 |
|
|
|
(55 |
) |
|
|
(0 |
)% |
|
Total equity |
|
|
79,909 |
|
|
|
34,212 |
|
|
|
45,697 |
|
|
|
134 |
% |
- Working capital is defined as total current assets minus total current liabilities.
n/m = not meaningful
Cash balances as of December 31, 2021 totaled $51.0 million, an increase of $42.8 million compared to $8.2 million as of December 31, 2020. Working capital as of December 31, 2021 totaled $46.7 million, an increase of $36.6 million compared to $10.1 million as of December 31, 2020.
Total assets as of December 31, 2021 were $91.0 million compared to $45.4 million as of December 31, 2020. Total borrowings, including accrued interest, remained constant at $5.9 million as of December 31, 2021 and 2020. Total liabilities decreased slightly as of December 31, 2021 to $11.1 million compared to $11.2 million as of December 31, 2020.
Total equity as of December 31, 2021 was $79.9 million compared to $34.2 million as of December 31, 2020.
The increases in working capital, total assets, and total equity were driven primarily by the net proceeds received from the IPO and operating profit and net income generated by the Company.
|
Fourth Quarter 2021 vs. Fourth Quarter 2020 Financial Highlights |
||||||||||||||||
|
|
|
THREE MONTHS ENDED |
|
|
CHANGE |
|
||||||||||
|
|
|
2021 |
|
|
2020 |
|
|
$ |
|
|
% |
|
||||
|
|
|
(in thousands USD, except for |
|
|
|
|
|
|
|
|||||||
|
CONSOLIDATED STATEMENTS OF |
|
|||||||||||||||
|
Revenue |
|
|
10,291 |
|
|
|
10,267 |
|
|
|
24 |
|
|
|
0 |
% |
|
Operating expenses |
|
|
(9,668 |
) |
|
|
(5,897 |
) |
|
|
(3,771 |
) |
|
|
64 |
% |
|
Operating profit |
|
|
623 |
|
|
|
4,370 |
|
|
|
(3,747 |
) |
|
|
(86 |
)% |
|
Income before tax |
|
|
1,311 |
|
|
|
3,489 |
|
|
|
(2,178 |
) |
|
|
(62 |
)% |
|
Net income for the period attributable to the |
|
|
867 |
|
|
|
8,541 |
|
|
|
(7,674 |
) |
|
|
(90 |
)% |
|
Net income per share attributable to ordinary |
|
|
0.03 |
|
|
|
0.39 |
|
|
|
(0.36 |
) |
|
|
(92 |
)% |
|
Net income per share attributable to ordinary |
|
|
0.02 |
|
|
|
0.35 |
|
|
|
(0.33 |
) |
|
|
(94 |
)% |
|
|
|
THREE MONTHS ENDED |
|
|
CHANGE |
|
||||||||||
|
|
|
2021 |
|
|
2020 |
|
|
$ |
|
|
% |
|
||||
|
|
|
(in thousands USD, |
|
|
|
|
|
|
|
|||||||
|
NON-IFRS FINANCIAL MEASURES |
|
|
|
|
|
|
|
|
|
|
|
|
||||
|
Adjusted EBITDA |
|
|
2,272 |
|
|
|
6,115 |
|
|
|
(3,843 |
) |
|
|
(63 |
)% |
|
Adjusted EBITDA Margin |
|
|
22 |
% |
|
|
60 |
% |
|
n/m |
|
|
|
(38 |
)% |
|
|
Free Cash Flow |
|
|
(1,811 |
) |
|
|
3,533 |
|
|
|
(5,344 |
) |
|
|
(151 |
)% |
n/m = not meaningful
|
|
|
THREE MONTHS ENDED |
|
|
CHANGE |
|
||||||||||
|
|
|
2021 |
|
|
2020 |
|
|
Amount |
|
|
% |
|
||||
|
|
|
(in thousands, unaudited) |
|
|
|
|
|
|
|
|||||||
|
OTHER SUPPLEMENTAL DATA |
|
|
|
|
|
|
|
|
|
|
|
|
||||
|
New Depositing Customers (1) |
|
|
28 |
|
|
|
35 |
|
|
|
(7 |
) |
|
|
(20 |
)% |
- We define New Depositing Customers, or NDCs, as unique referral of a player from our system to one of our customers that satisfied an agreed metric (typically making a deposit above a minimum threshold) with the customer, thereby triggering the right to a commission for us.
Revenue
Total revenue in the fourth quarter remained relatively constant at $10.3 million. On a constant currency basis, revenue remained relatively constant. NDCs decreased 20% to 28,000 compared to 35,000 in the prior year. We attribute the improved monetization of NDCs to a combination of technology improvements and changes in product and market mix.
Our revenue disaggregated by market is as follows:
|
|
|
THREE MONTHS ENDED |
|
|
CHANGE |
|
||||||||||
|
|
|
2021 |
|
|
2020 |
|
|
$ |
|
|
% |
|
||||
|
|
|
(in thousands USD, unaudited) |
|
|
|
|
|
|
|
|||||||
|
U.K. and Ireland |
|
|
5,226 |
|
|
|
5,780 |
|
|
|
(554 |
) |
|
|
(10 |
)% |
|
Other Europe |
|
|
2,260 |
|
|
|
2,299 |
|
|
|
(39 |
) |
|
|
(2 |
)% |
|
North America |
|
|
2,154 |
|
|
|
1,383 |
|
|
|
771 |
|
|
|
56 |
% |
|
Rest of the world |
|
|
651 |
|
|
|
805 |
|
|
|
(154 |
) |
|
|
(19 |
)% |
|
Total revenues |
|
|
10,291 |
|
|
|
10,267 |
|
|
|
24 |
|
|
|
0 |
% |
Changes in revenue were driven by strong organic growth in our North American markets, offset by a decline in the U.K. and Ireland and, to a lesser extent, Other Europe and Rest of the world. U.K. and Ireland revenue was negatively affected by higher than usual volatility in organic search traffic. In the comparable period, U.K. and Ireland revenue was positively affected by increased demand coinciding with restrictive Covid-19 measures. Other Europe was negatively affected by regulatory changes in Germany implemented in July 2021 partly offset by growth in revenue from other European markets.
Our revenue disaggregated by monetization is as follows:
|
|
|
THREE MONTHS ENDED |
|
|
CHANGE |
|
||||||||||
|
|
|
2021 |
|
|
2020 |
|
|
$ |
|
|
% |
|
||||
|
|
|
(in thousands USD, unaudited) |
|
|
|
|
|
|
|
|||||||
|
Hybrid commission |
|
|
2,935 |
|
|
|
5,557 |
|
|
|
(2,622 |
) |
|
|
(47 |
)% |
|
Revenue share commission |
|
|
744 |
|
|
|
1,004 |
|
|
|
(260 |
) |
|
|
(26 |
)% |
|
CPA commission |
|
|
5,202 |
|
|
|
3,271 |
|
|
|
1,931 |
|
|
|
59 |
% |
|
Other revenue |
|
|
1,410 |
|
|
|
435 |
|
|
|
975 |
|
|
|
224 |
% |
|
Total revenues |
|
|
10,291 |
|
|
|
10,267 |
|
|
|
24 |
|
|
|
0 |
% |
Revenue from CPA commission and Other revenue increased whereas revenue from hybrid and revenue share commission decreased. The changes in monetization were primarily a result of changes in market mix with a higher proportion of revenue from the U.S compared to the previous year. The increase in Other revenue was driven primarily by bonuses related to achieving certain operator NDC performance targets and fixed fees.
Our revenue disaggregated by product type from which it is derived is as follows:
|
|
|
THREE MONTHS ENDED |
|
|
CHANGE |
|
||||||||||
|
|
|
2021 |
|
|
2020 |
|
|
$ |
|
|
% |
|
||||
|
|
|
(in thousands USD, unaudited) |
|
|
|
|
|
|
|
|||||||
|
Casino |
|
|
8,466 |
|
|
|
8,846 |
|
|
|
(380 |
) |
|
|
(4 |
)% |
|
Sports |
|
|
1,769 |
|
|
|
1,160 |
|
|
|
609 |
|
|
|
53 |
% |
|
Other |
|
|
56 |
|
|
|
261 |
|
|
|
(205 |
) |
|
|
(79 |
)% |
|
Total revenues |
|
|
10,291 |
|
|
|
10,267 |
|
|
|
24 |
|
|
|
0 |
% |
Revenue increases were driven by growth in revenue from sports products offset by a decrease in casino and other revenue.
Operating Expenses
|
|
|
THREE MONTHS ENDED |
|
|
CHANGE |
|
||||||||||
|
|
|
2021 |
|
|
2020 |
|
|
$ |
|
|
% |
|
||||
|
|
|
(in thousands USD, unaudited) |
|
|
|
|
|
|
|
|||||||
|
Sales and marketing expenses |
|
|
4,632 |
|
|
|
2,442 |
|
|
|
2,190 |
|
|
|
90 |
% |
|
Technology expenses |
|
|
1,190 |
|
|
|
798 |
|
|
|
392 |
|
|
|
49 |
% |
|
General and administrative expenses |
|
|
3,877 |
|
|
|
2,609 |
|
|
|
1,268 |
|
|
|
49 |
% |
|
Movements in credit losses allowance and write offs |
|
|
(31 |
) |
|
|
48 |
|
|
|
(79 |
) |
|
|
(165 |
)% |
|
Total operating expenses |
|
|
9,668 |
|
|
|
5,897 |
|
|
|
3,771 |
|
|
|
64 |
% |
Total operating expenses increased by $3.8 million to $9.7 million compared to $5.9 million in the prior year. On a constant currency basis, operating expenses increased by $3.6 million, or 58%. The increase was driven primarily by headcount across Sales and Marketing, Technology, and General and Administrative functions as we invest in the Company’s organic growth initiatives as well as increased administrative expenses associated with operating as a public company.
Sales and Marketing expenses totaled $4.6 million compared to $2.4 million in the prior year. The increase was driven primarily by increased wages and salary expenses associated with increased headcount.
Technology expenses totaled $1.2 million compared to $0.8 million in the prior year. The increase was driven primarily by increased wages and salary expenses associated with increased headcount partially offset by capitalized development costs.
General and Administrative expenses totaled $3.9 million compared to $2.6 million in the prior year. The increase was driven primarily by increased wages and salary expenses associated with increased headcount, professional services, and insurance expenses.
Earnings
Adjusted EBITDA decreased by 63% to $2.3 million compared to $6.1 million in the prior year representing an Adjusted EBITDA margin of 22%. The decrease was driven by increased operating expenses.
Operating profit in the fourth quarter decreased 86% to $0.6 million compared to $4.4 million in 2020. The decrease was driven primarily by a decrease in Adjusted EBITDA and an increase in share-based payments expense.
Net income in the fourth quarter totaled $0.9 million, or $0.02 per diluted share, compared to net income of $8.5 million, or $0.35 per diluted share, in the prior year. Net income in the forth quarter 2021 was positively affected by a USD/Euro foreign currency exchange gain of $1.1 million (zero in 2020). While net income in the fourth quarter of 2020 was positively affected by the recognition of deferred tax assets of $5.4 million (deferred tax asset reduction of $0.2 million in 2021).
Powered by WPeMatico


Bronze card has been claimed during the group stage; silver and gold prizes remain available until 31 July.
Tonybet said it has paid out its first major prize in its World Cup Card Collection campaign for Canadian customers (excluding Ontario), after a player secured the promotion’s bronze card worth $15,000 CAD.
The operator said the World Cup Card Collection includes 51 cards to collect during the tournament: 48 digital cards tied to participating World Cup nations, plus three unique cards—gold, silver and bronze—linked to a $150,000 CAD total prize fund.
According to Tonybet, the bronze card has been available through the World Cup’s group stage and has now been claimed. The silver card is available during the knockout rounds up to the quarter-finals, while the gold card is held back for the closing semi-finals and final.
Tonybet Head of Product Kiryl Liudvikevich said: “With Canada co-hosting the World Cup for the first time, the tournament has felt closer to home than ever before for Canadians, and it has already delivered a moment most supporters could only dream about with the national team advancing to the knockout stages.
“For one lucky Canada supporter, it has now produced another story that will be worth retelling long after the final whistle has gone – with our lucky winner among the first Tonybet customers to win one of the unique cards in our World Cup Card Collection, taking home a cool $15,000 for managing to get his hands on bronze. Who will end up with silver and gold?”
Tonybet said the same three unique cards are also in circulation across its other markets, with varying outcomes so far. The World Cup Card Collection campaign runs until 31 July, with a $150,000 CAD prize pool for Canada and separate prize pools in other markets.
The post Tonybet pays first $15,000 CAD prize in World Cup Card Collection Canada promo appeared first on EE Gaming | Global iGaming & Tech Intelligence Hub.

Tonybet’s World Cup Card Collection for Canadian customers has found its first major winner, with one lucky player taking home $15,000 CAD for securing the campaign’s prized bronze card.
There are 51 cards in total to collect during the tournament for Tonybet’s Canadian playerbase (excluding Ontario), including 48 digital cards – one for each participating World Cup nation – and three unique cards available in gold, silver and bronze – with a $150,000 CAD total prize fund on offer.
The three unique cards reward winners with prizes of $100,000 CAD for gold, $35,000 CAD for silver and $15,000 CAD for bronze – and the bronze card has now been discovered by a Tonybet customer, having been on on offer through the World Cup’s group stage.
The silver card comes into play during the knockout rounds up to the quarter-finals, with the gold card held back for the closing semi-finals and final.
Tonybet Head of Product Kiryl Liudvikevich said: “With Canada co-hosting the World Cup for the first time, the tournament has felt closer to home than ever before for Canadians, and it has already delivered a moment most supporters could only dream about with the national team advancing to the knockout stages.
“For one lucky Canada supporter, it has now produced another story that will be worth retelling long after the final whistle has gone – with our lucky winner among the first Tonybet customers to win one of the unique cards in our World Cup Card Collection, taking home a cool $15,000 for managing to get his hands on bronze. Who will end up with silver and gold?”
The same three cards are in circulation across Tonybet’s other markets. In some, a bronze has already been claimed; in others, all three are still waiting to be found.
Tonybet’s World Cup Card Collection runs until 31 July, with a $150,000 CAD prize pool (and separate pools running across its other markets).
The post Tonybet’s World Cup Card Collection campaign lands first $15k Bronze winner appeared first on Americas iGaming & Sports Betting News.

Gaming Corps has launched its casino game portfolio with Ontario Lottery and Gaming Corporation (OLG) in Ontario, bringing a selection of the Swedish studio’s titles to OLG’s digital casino audience.
The rollout includes football-themed games timed to the summer football calendar. Titles going live with OLG include Goals to Glory: Football Fever, Penalty Champion: Goals to Glory, and Goals to Glory: Instant Blitz, part of Gaming Corps’ Instant Blitz series.
OLG is a provincial crown agency that has operated in Ontario since 1975, with responsibilities spanning land-based gaming facilities, province-wide lottery games, internet gaming, bingo, and electronic gaming products at Charitable Gaming Centres.
Graham Greensmith, Chief Commercial Officer at Gaming Corps, said: “Launching with OLG gives Gaming Corps outstanding visibility in one of the most exciting regulated markets in North America. The timing could not be better. As global football moves into focus, we are bringing OLG a fantastic line-up that speaks directly to the moment, while also introducing some of our most recognisable titles, mechanics and characters.”
Ian Shelswell, Director, iCasino Product, Partnerships & Development at OLG, added: “OLG is always looking to bring high-quality content to our players, and Gaming Corps’ portfolio adds further variety to our iCasino offering at an exciting time in the sporting calendar. The combination of football-themed releases, instant win content, recognisable slot franchises and engaging game mechanics makes this a strong addition to our casino catalogue. We are pleased to welcome Gaming Corps to OLG and look forward to developing the partnership.”
The post Gaming Corps goes live with OLG iCasino in Ontario appeared first on EE Gaming | Global iGaming & Tech Intelligence Hub.

-

 Bragg Gaming Group7 days ago
Massive Gaming launches Blitzcrown titles on Superbet Brazil via Bragg Hub
-
Alex Cuoci7 days ago
Wealthsimple and Kalshi Partner to Bring Prediction Markets to Canada
-
Compliance7 days ago
HIPTHER Launches HALLO: The Standard in Compliance Expertise
-
Bonusetu.com6 days ago
Finland Sets Casino Gambling Risk Limits at 2% of Income, 4 Days, 2 Game Types
-
Compliance Updates7 days ago
HIPTHER Launches HALLO: The Standard in Compliance Expertise
-
30-0 Kongeserien6 days ago
Kongebonus launches 30-0 Kongeserien Eliteserien fantasy draft game
-
Compliance Updates5 days ago
Dutch Gambling Trade Association Sues Meta Over Illegal Gambling Ads
-
Acquisitions/Merger6 days ago
Super agrees to acquire Romania’s Crafting Technologies for new Cluj tech hub