Canada
Gambling.com Group Reports Second Quarter 2022 Financial Results

Gambling.com Group Limited (Nasdaq: GAMB) (“Gambling.com Group” or the “Company”), a multi-award-winning performance marketing company and a leading provider of digital marketing services active in the global online gambling industry, today announced its operating and financial results for the second quarter ended June 30, 2022.
“We continued to execute on our strategy of rapidly growing our business in North America in the second quarter as the team delivered company-wide revenue growth of over 50% and North American revenue growth over 300%,” said Charles Gillespie, Chief Executive Officer and Co-founder of Gambling.com Group. “The strength of our business model was also on display, as we continued to deliver strong Adjusted EBITDA and Free Cash Flow despite the second quarter being the seasonally weakest and while investing in the organization to drive future growth. Our view remains that Gambling.com Group offers the best value proposition for online gambling operators’ investments in customer acquisition and we look forward to the second half of the year as we enter the heart of the North American fall and winter sports calendars.”
Second Quarter 2022 vs. Second Quarter 2021 Financial Highlights
(in thousands, USD, except per share data, unaudited)
|
|
Three Months Ended June 30, |
|
CHANGE |
||||||||
|
|
2022 |
|
2021 |
|
$ |
|
% |
||||
|
Revenue |
15,924 |
|
|
10,392 |
|
|
5,532 |
|
|
53 |
% |
|
Net income for the period attributable to the shareholders |
56 |
|
|
2,445 |
|
|
(2,389 |
) |
|
(98 |
)% |
|
Net income per share attributable to shareholders, diluted |
0.00 |
|
|
0.08 |
|
|
(0.08 |
) |
|
(100 |
)% |
|
Adjusted net income for the period attributable to shareholders |
3,065 |
|
|
2,445 |
|
|
620 |
|
|
25 |
% |
|
Adjusted net income per share attributable to shareholders, diluted |
0.09 |
|
|
0.08 |
|
|
0.01 |
|
|
9 |
% |
|
Adjusted EBITDA |
3,617 |
|
|
5,518 |
|
|
(1,901 |
) |
|
(34 |
)% |
|
Adjusted EBITDA Margin |
23 |
% |
|
53 |
% |
|
|
|
(30 |
)% |
|
|
Cash flow from operations |
3,460 |
|
|
4,738 |
|
|
(1,278 |
) |
|
(27 |
)% |
|
Free Cash Flow |
2,914 |
|
|
3,122 |
|
|
(208 |
) |
|
(7 |
)% |
Second Quarter 2022 Business Highlights
- North American revenue grew 342% to $6.2 million
- Delivered more than 57,000 new depositing customers
- Successful new market launch in Ontario
- Added Michael Quartieri to the Board of Directors, effective as of June 30, 2022
- Inclusion of GAMB shares in the Russell 3000 index and various sub-indexes
- Contribution from BonusFinder.com is ahead of plan
Elias Mark, Chief Financial Officer of Gambling.com Group, added, “We delivered revenue and Adjusted EBITDA ahead of the street consensus and generated strong Free Cash Flow in the quarter. Revenue growth continued to be led by growth in North America in line with our strategic objectives, but we also saw strong trading in our more mature markets in the UK and Ireland despite the weakening of the GBP and EUR against the US dollar. Integration of our acquisitions from Q1 is tracking according to plan. The Company remains well capitalized and in a strong position to meet the financial outlook for the year and to continue to grow profitably beyond.”
2022 Outlook
For the fiscal year 2022, based on currently available information, the Company reiterates its fiscal 2022 guidance and estimates:
- Total revenue will be in the range of $71 million and $76 million; and
- Adjusted EBITDA will be in the range $22 million and $27 million.
Conference Call Details
|
Date/Time: |
Monday, August 29, 2022, at 4:30 pm EDT |
|||
|
Webcast: |
||||
|
U.S. Toll-Free Dial In: |
877-407-0890 |
|||
|
International Dial In: |
+1-201-389-0918 |
|||
To access, please dial in approximately 10 minutes before the start of the call. An accompanying slide presentation will be available in PDF format within the News & Events section of the Company’s website.
An archived webcast of the conference call will also be available in the News & Events section of the Company’s website at gambling.com/corporate/investors/news-events.
About Gambling.com Group Limited
Gambling.com Group Limited (Nasdaq: GAMB) is a multi-award-winning performance marketing company and a leading provider of digital marketing services active in the online gambling industry. Founded in 2006, the Group operates from offices in the United States, Ireland and Malta. Through its proprietary technology platform, the Group publishes a portfolio of premier branded websites including Gambling.com, Bookies.com and RotoWire.com. As of July 31, 2022, the Group owns and operates more than 50 websites in seven languages across 15 national markets covering all aspects of the online gambling industry, including iGaming and sports betting, and the fantasy sports industry.
Use of Non-IFRS Measures
This release contains certain non-IFRS financial measures, such as Adjusted Net Income, Adjusted EBITDA, Adjusted EBITDA Margin, Free Cash Flow, and related ratios. See ”Supplemental Information – Non-IFRS Financial Measures” and the tables at the end of this release for an explanation of the adjustments and reconciliations to the comparable IFRS numbers.
Cautionary Note Concerning Forward-Looking Statements
This press release contains forward-looking statements within the meaning of Section 27A of the Securities Act of 1933, as amended, Section 21E of the Securities Exchange Act of 1934, as amended, and the safe harbor provisions of the U.S. Private Securities Litigation Reform Act of 1995, that relate to our current expectations and views of future events. All statements other than statements of historical facts contained in this press release, including statements relating to our 2022 outlook, are all forward-looking statements. These statements represent our opinions, expectations, beliefs, intentions, estimates or strategies regarding the future, which may not be realized. In some cases, you can identify forward-looking statements by terms such as “believe,” “may,” “estimate,” “continue,” “anticipate,” “intend,” “should,” “plan,” “expect,” “predict,” “potential,” “could,” “will,” “would,” “ongoing,” “future” or the negative of these terms or other similar expressions that are intended to identify forward-looking statements, although not all forward-looking statements contain these identifying words. Forward-looking statements are based largely on our current expectations and projections about future events and financial trends that we believe may affect our financial condition, results of operations, business strategy, short-term and long-term business operations and objectives and financial needs. These forward-looking statements involve known and unknown risks, uncertainties, contingencies, changes in circumstances that are difficult to predict and other important factors that may cause our actual results, performance or achievements to be materially and/or significantly different from any future results, performance or achievements expressed or implied by the forward-looking statement. Important factors that could cause actual results to differ materially from our expectations are discussed under “Item 3. Key Information – Risk Factors” in Gambling.com Group’s annual report filed on Form 20-F for the year ended December 31, 2021 with the US Securities and Exchange Commission (the “SEC”) on March 25, 2022, and Gambling.com Group’s other filings with the SEC as such factors may be updated from time to time. Any forward-looking statements contained in this press release speak only as of the date hereof and accordingly undue reliance should not be placed on such statements. Gambling.com Group disclaims any obligation or undertaking to update or revise any forward-looking statements contained in this press release, whether as a result of new information, future events or otherwise, other than to the extent required by applicable law.
|
|
|||||||||||
|
Condensed Consolidated Statements of Comprehensive Income (Unaudited) |
|||||||||||
|
|
|
|
|
||||||||
|
|
Three Months Ended June 30, |
|
Six Months Ended June 30, |
||||||||
|
|
2022 |
|
2021 |
|
2022 |
|
2021 |
||||
|
|
|
|
|
|
|
|
|
||||
|
Revenue |
15,924 |
|
|
10,392 |
|
|
35,509 |
|
|
21,909 |
|
|
Cost of sales |
(495 |
) |
|
— |
|
|
(1,724 |
) |
|
— |
|
|
Gross profit |
15,429 |
|
|
10,392 |
|
|
33,785 |
|
|
21,909 |
|
|
Sales and marketing expenses |
(8,454 |
) |
|
(3,144 |
) |
|
(15,816 |
) |
|
(5,848 |
) |
|
Technology expenses |
(1,499 |
) |
|
(944 |
) |
|
(2,862 |
) |
|
(1,634 |
) |
|
General and administrative expenses |
(4,804 |
) |
|
(3,387 |
) |
|
(9,632 |
) |
|
(6,159 |
) |
|
Fair value movement on contingent consideration |
(2,849 |
) |
|
— |
|
|
(2,849 |
) |
|
— |
|
|
Movements in credit losses allowance and write-offs |
(72 |
) |
|
240 |
|
|
(597 |
) |
|
100 |
|
|
Operating profit (loss) |
(2,249 |
) |
|
3,157 |
|
|
2,029 |
|
|
8,368 |
|
|
Finance income |
3,491 |
|
|
394 |
|
|
4,319 |
|
|
552 |
|
|
Finance expense |
(1,056 |
) |
|
(524 |
) |
|
(1,307 |
) |
|
(761 |
) |
|
Income before tax |
186 |
|
|
3,027 |
|
|
5,041 |
|
|
8,159 |
|
|
Income tax charge |
(130 |
) |
|
(582 |
) |
|
(499 |
) |
|
(1,248 |
) |
|
Net income for the period attributable to the shareholders |
56 |
|
|
2,445 |
|
|
4,542 |
|
|
6,911 |
|
|
Other comprehensive (loss) income |
|
|
|
|
|
|
|
||||
|
Exchange differences on translating foreign currencies |
(6,559 |
) |
|
490 |
|
|
(7,928 |
) |
|
(1,202 |
) |
|
Total comprehensive (loss) income for the period attributable to the shareholders |
(6,503 |
) |
|
2,935 |
|
|
(3,386 |
) |
|
5,709 |
|
|
Net income per share attributable to shareholders, basic |
0.00 |
|
|
0.09 |
|
|
0.13 |
|
|
0.24 |
|
|
Net income per share attributable to shareholders, diluted |
0.00 |
|
|
0.08 |
|
|
0.13 |
|
|
0.22 |
|
|
Condensed Consolidated Statements of Financial Position (Unaudited) |
|||||
|
|
|||||
|
|
JUNE 30, 2022 |
|
DECEMBER 31, 2021 |
||
|
ASSETS |
|
|
|
||
|
Non-current assets |
|
|
|
||
|
Property and equipment |
644 |
|
|
569 |
|
|
Intangible assets |
83,076 |
|
|
25,419 |
|
|
Right-of-use assets |
1,896 |
|
|
1,465 |
|
|
Other non-current assets |
40 |
|
|
— |
|
|
Deferred tax asset |
6,104 |
|
|
7,028 |
|
|
Total non-current assets |
91,760 |
|
|
34,481 |
|
|
Current assets |
|
|
|
||
|
Trade and other receivables |
8,956 |
|
|
5,497 |
|
|
Cash and cash equivalents |
31,102 |
|
|
51,047 |
|
|
Total current assets |
40,058 |
|
|
56,544 |
|
|
Total assets |
131,818 |
|
|
91,025 |
|
|
EQUITY AND LIABILITIES |
|
|
|
||
|
Equity |
|
|
|
||
|
Share capital |
— |
|
|
— |
|
|
Capital reserve |
63,711 |
|
|
55,953 |
|
|
Share options and warrants reserve |
2,901 |
|
|
2,442 |
|
|
Foreign exchange translation reserve |
(10,210 |
) |
|
(2,282 |
) |
|
Retained earnings |
28,550 |
|
|
23,796 |
|
|
Total equity |
84,952 |
|
|
79,909 |
|
|
Non-current liabilities |
|
|
|
||
|
Deferred consideration |
4,664 |
|
|
— |
|
|
Contingent consideration |
9,540 |
|
|
— |
|
|
Lease liability |
1,702 |
|
|
1,286 |
|
|
Deferred tax liability |
3,584 |
|
|
— |
|
|
Total non-current liabilities |
19,490 |
|
|
1,286 |
|
|
Current liabilities |
|
|
|
||
|
Trade and other payables |
5,343 |
|
|
3,291 |
|
|
Deferred consideration |
2,745 |
|
|
— |
|
|
Contingent consideration |
12,218 |
|
|
— |
|
|
Other liability |
165 |
|
|
— |
|
|
Borrowings |
6,107 |
|
|
5,944 |
|
|
Lease liability |
420 |
|
|
393 |
|
|
Income tax payable |
378 |
|
|
202 |
|
|
Total current liabilities |
27,376 |
|
|
9,830 |
|
|
Total liabilities |
46,866 |
|
|
11,116 |
|
|
Total equity and liabilities |
131,818 |
|
|
91,025 |
|
|
Condensed Consolidated Statements of Cash Flows (Unaudited) |
|||||||||||
|
|
|||||||||||
|
|
Three Months Ended June 30, |
|
Six Months Ended June 30, |
||||||||
|
|
2022 |
|
2021 |
|
2022 |
|
2021 |
||||
|
|
|
|
|
|
|
|
|
||||
|
Cash flow from operating activities |
|
|
|
|
|
|
|
||||
|
Income before tax |
186 |
|
|
3,027 |
|
|
5,041 |
|
|
8,159 |
|
|
Finance expenses (income), net |
(2,435 |
) |
|
130 |
|
|
(3,012 |
) |
|
209 |
|
|
Adjustments for non-cash items: |
|
|
|
|
|
|
|
||||
|
Depreciation and amortization |
1,952 |
|
|
634 |
|
|
3,778 |
|
|
1,216 |
|
|
Movements in credit loss allowance and write-offs |
71 |
|
|
(240 |
) |
|
597 |
|
|
(100 |
) |
|
Fair value movement on contingent consideration |
2,849 |
|
|
— |
|
|
2,849 |
|
|
— |
|
|
Share option charge |
885 |
|
|
245 |
|
|
1,609 |
|
|
1,063 |
|
|
Cash flows from operating activities before changes in working capital |
3,508 |
|
|
3,796 |
|
|
10,862 |
|
|
10,547 |
|
|
Changes in working capital |
|
|
|
|
|
|
|
||||
|
Trade and other receivables |
2,549 |
|
|
14 |
|
|
(2,639 |
) |
|
(1,243 |
) |
|
Trade and other payables |
(1,014 |
) |
|
1,464 |
|
|
304 |
|
|
2,710 |
|
|
Warrants repurchased |
(800 |
) |
|
— |
|
|
(800 |
) |
|
— |
|
|
Income tax paid |
(783 |
) |
|
(536 |
) |
|
(783 |
) |
|
(536 |
) |
|
Cash flows generated by operating activities |
3,460 |
|
|
4,738 |
|
|
6,944 |
|
|
11,478 |
|
|
Cash flows from investing activities |
|
|
|
|
|
|
|
||||
|
Acquisition of property and equipment |
(99 |
) |
|
(188 |
) |
|
(242 |
) |
|
(218 |
) |
|
Acquisition of intangible assets |
(447 |
) |
|
(1,428 |
) |
|
(2,516 |
) |
|
(1,741 |
) |
|
Acquisition of subsidiaries, net of cash acquired |
(4,114 |
) |
|
— |
|
|
(23,409 |
) |
|
— |
|
|
Cash flows used in investing activities |
(4,660 |
) |
|
(1,616 |
) |
|
(26,167 |
) |
|
(1,959 |
) |
|
Cash flows from financing activities |
|
|
|
|
|
|
|
||||
|
Interest paid |
— |
|
|
— |
|
|
(120 |
) |
|
(121 |
) |
|
Principal paid on lease liability |
(79 |
) |
|
(49 |
) |
|
(165 |
) |
|
(95 |
) |
|
Interest paid on lease liability |
(45 |
) |
|
(47 |
) |
|
(95 |
) |
|
(96 |
) |
|
Cash flows used in financing activities |
(124 |
) |
|
(96 |
) |
|
(380 |
) |
|
(312 |
) |
|
Net movement in cash and cash equivalents |
(1,324 |
) |
|
3,026 |
|
|
(19,603 |
) |
|
9,207 |
|
|
Cash and cash equivalents at the beginning of the period |
33,069 |
|
|
14,035 |
|
|
51,047 |
|
|
8,225 |
|
|
Net foreign exchange differences on cash and cash equivalents |
(643 |
) |
|
107 |
|
|
(342 |
) |
|
(264 |
) |
|
Cash and cash equivalents at the end of the period |
31,102 |
|
|
17,168 |
|
|
31,102 |
|
|
17,168 |
|
Earnings Per Share
Below is a reconciliation of basic and diluted earnings per share as presented in the Unaudited Interim Condensed Consolidated Statement of Income for the period specified (USD in thousands, except share amounts, unaudited):
|
|
Three Months Ended June 30, |
|
Six Months Ended June 30, |
||||
|
|
2022 |
|
2021 |
|
2022 |
|
2021 |
|
Net income for the period attributable to the shareholders |
56 |
|
2,445 |
|
4,542 |
|
6,911 |
|
Weighted-average number of ordinary shares, basic |
35,443,258 |
|
28,556,422 |
|
35,176,469 |
|
28,556,422 |
|
Net income per share attributable to shareholders, basic |
0.00 |
|
0.09 |
|
0.13 |
|
0.24 |
|
|
|
|
|
|
|
|
|
|
Net income for the period attributable to the shareholders |
56 |
|
2,445 |
|
4,542 |
|
6,911 |
|
Weighted-average number of ordinary shares, diluted |
36,057,597 |
|
31,401,166 |
|
36,131,524 |
|
31,401,166 |
|
Net income per share attributable to shareholders, diluted |
0.00 |
|
0.08 |
|
0.13 |
|
0.22 |
Supplemental Information
Rounding
We have made rounding adjustments to some of the figures included in the discussion and analysis of our financial condition and results of operations together with our condensed consolidated financial statements and the related notes thereto. Accordingly, numerical figures shown as totals in some tables may not be an arithmetic aggregation of the figures that preceded them.
Non-IFRS Financial Measures
Management uses several financial measures, both IFRS and non-IFRS financial measures in analyzing and assessing the overall performance of the business and for making operational decisions.
Adjusted Net Income and Adjusted Net Income Per Share
Adjusted net income is a non-IFRS financial measure defined as net income attributable to equity holders excluding the fair value gain or loss related to contingent consideration. Adjusted net income per diluted share is a non-IFRS financial measure defined as Adjusted net income attributable to equity holders divided by the diluted weighted average number of common shares outstanding.
We believe Adjusted net income and Adjusted net income per diluted share are useful to our management as a measure of comparative operating performance from period to period as they removes the effect of the fair value gain or loss related to the contingent consideration which is not directly associated with our core operations. We expect to incur gains or losses related to the contingent consideration until April 2024. See Note 4 of the Unaudited Interim Condensed Consolidated Financial Statements for the period ended June 30, 2022 for a complete discussion of the contingent consideration.
Below is a reconciliation to Adjusted net income attributable to equity holders and Adjusted net income per share, diluted from net income for the period attributable to the equity holders and net income per share attributed to ordinary shareholders, diluted as presented in the Condensed Consolidated Statements of Comprehensive Income and for the period specified:
|
|
Three Months Ended June 30, |
|
Six Months Ended June 30, |
||||
|
|
2022 |
|
2021 |
|
2022 |
|
2021 |
|
|
(in thousands USD, except for share and per share data, unaudited) |
|
(in thousands USD, except for share and per share data, unaudited) |
||||
|
Net income for the period attributable to the shareholders |
56 |
|
2,445 |
|
4,542 |
|
6,911 |
|
Fair value movement on contingent consideration |
2,849 |
|
— |
|
2,849 |
|
— |
|
Unwinding of deferred consideration |
160 |
|
— |
|
160 |
|
— |
|
Adjusted net income for the period attributable to shareholders |
3,065 |
|
2,445 |
|
7,551 |
|
6,911 |
|
Weighted-average number of ordinary shares, basic |
35,443,258 |
|
28,556,422 |
|
35,176,469 |
|
28,556,422 |
|
Net income per share attributable to shareholders, basic |
0.00 |
|
0.09 |
|
0.13 |
|
0.24 |
|
Adjusted net income per share attributable to shareholders, basic |
0.09 |
|
0.09 |
|
0.21 |
|
0.24 |
|
Adjusted net income for the period attributable to shareholders |
3,065 |
|
2,445 |
|
7,551 |
|
6,911 |
|
Weighted-average number of ordinary shares, diluted |
36,057,597 |
|
31,401,166 |
|
36,131,524 |
|
31,401,166 |
|
Net income per share attributable to shareholders, diluted |
0.00 |
|
0.08 |
|
0.13 |
|
0.22 |
|
Adjusted net income per share attributable to shareholders, diluted |
0.09 |
|
0.08 |
|
0.21 |
|
0.22 |
Adjusted EBITDA and Adjusted EBITDA Margin
Adjusted EBITDA is a non-IFRS financial measure defined as earnings excluding net finance costs, income tax charge, depreciation, and amortization, effect of non-recurring items, significant non-cash items, share-based payment expense and other items that our board of directors believes do not reflect the underlying performance of the business. Adjusted EBITDA Margin is a non-IFRS measure defined as Adjusted EBITDA as a percentage of revenue.
We believe Adjusted EBITDA and Adjusted EBITDA Margin are useful to our management as a measure of comparative operating performance from period to period as they remove the effect of items not directly resulting from our core operations including effects that are generated by differences in capital structure, depreciation, tax effects and non-recurring events.
While we use Adjusted EBITDA and Adjusted EBITDA Margin as tools to enhance our understanding of certain aspects of our financial performance, we do not believe that Adjusted EBITDA and Adjusted EBITDA Margin are substitutes for, or superior to, the information provided by IFRS results. As such, the presentation of Adjusted EBITDA and Adjusted EBITDA Margin is not intended to be considered in isolation or as a substitute for any measure prepared in accordance with IFRS. The primary limitations associated with the use of Adjusted EBITDA and Adjusted EBITDA Margin as compared to IFRS results are that Adjusted EBITDA and Adjusted EBITDA Margin as we define them may not be comparable to similarly titled measures used by other companies in our industry and that Adjusted EBITDA and Adjusted EBITDA Margin may exclude financial information that some investors may consider important in evaluating our performance.
Below is a reconciliation to Adjusted EBITDA from net income for the period attributable to the equity holders as presented in the Condensed Consolidated Statements of Comprehensive Income and for the period specified:
|
|
Three Months Ended June 30, |
|
CHANGE |
|
Six Months Ended June 30, |
|
CHANGE |
||||||||||||||
|
|
2022 |
|
2021 |
|
$ |
|
% |
|
2022 |
|
2021 |
|
$ |
|
% |
||||||
|
|
(in thousands USD, unaudited) |
|
|
|
|
|
(in thousands USD, unaudited) |
|
|
|
|
||||||||||
|
Net income for the period attributable to the shareholders |
56 |
|
|
2,445 |
|
(2,389 |
) |
|
(98 |
)% |
|
4,542 |
|
|
6,911 |
|
(2,369 |
) |
|
(34 |
)% |
|
Add Back: |
|
|
|
|
|
|
|
|
|
|
|
|
|
|
|
||||||
|
Net finance costs (income) (1) |
(2,435 |
) |
|
130 |
|
(2,565 |
) |
|
n/m |
|
|
(3,012 |
) |
|
209 |
|
(3,221 |
) |
|
n/m |
|
|
Income tax charge |
130 |
|
|
582 |
|
(452 |
) |
|
(78 |
)% |
|
499 |
|
|
1,248 |
|
(749 |
) |
|
(60 |
)% |
|
Depreciation expense |
44 |
|
|
47 |
|
(3 |
) |
|
(6 |
)% |
|
87 |
|
|
82 |
|
5 |
|
|
6 |
% |
|
Amortization expense |
1,908 |
|
|
587 |
|
1,321 |
|
|
n/m |
|
|
3,691 |
|
|
1,134 |
|
2,557 |
|
|
n/m |
|
|
Share-based payments |
885 |
|
|
245 |
|
640 |
|
|
n/m |
|
|
1,609 |
|
|
1,063 |
|
546 |
|
|
51 |
% |
|
Fair value movement on contingent consideration |
2,849 |
|
|
— |
|
2,849 |
|
|
n/m |
|
|
2,849 |
|
|
— |
|
2,849 |
|
|
n/m |
|
|
Accounting and legal fees related to offering |
— |
|
|
392 |
|
(392 |
) |
|
n/m |
|
|
— |
|
|
898 |
|
(898 |
) |
|
n/m |
|
|
Bonuses related to the offering |
— |
|
|
1,090 |
|
(1,090 |
) |
|
n/m |
|
|
— |
|
|
1,090 |
|
(1,090 |
) |
|
n/m |
|
|
Acquisition related costs (2) |
180 |
|
|
— |
|
180 |
|
|
n/m |
|
|
454 |
|
|
— |
|
454 |
|
|
n/m |
|
|
Adjusted EBITDA |
3,617 |
|
|
5,518 |
|
(1,901 |
) |
|
(34 |
)% |
|
10,719 |
|
|
12,635 |
|
(1,916 |
) |
|
(15 |
)% |
|
________________ |
|
|
(1) |
Net finance (income) costs is comprised of finance income, and finance expense including unwinding of deferred consideration and foreign exchange gains (losses). |
|
(2) |
The acquisition costs are related to the business combinations of the Group. |
|
n/m = not meaningful |
|
Below is the Adjusted EBITDA Margin calculation for the period specified:
|
|
Three Months Ended June 30, |
|
CHANGE |
|
Six Months Ended June 30, |
|
CHANGE |
||||||||||||||||
|
|
2022 |
|
2021 |
|
$ |
|
% |
|
2022 |
|
2021 |
|
$ |
|
% |
||||||||
|
|
(in thousands, USD, unaudited) |
|
|
|
|
|
(in thousands, USD, unaudited) |
|
|
|
|
||||||||||||
|
Revenue |
15,924 |
|
|
10,392 |
|
|
5,532 |
|
|
53 |
% |
|
35,509 |
|
|
21,909 |
|
|
13,600 |
|
|
62 |
% |
|
Adjusted EBITDA |
3,617 |
|
|
5,518 |
|
|
(1,901 |
) |
|
(34 |
)% |
|
10,719 |
|
|
12,635 |
|
|
(1,916 |
) |
|
(15 |
)% |
|
Adjusted EBITDA Margin |
23 |
% |
|
53 |
% |
|
|
|
(30 |
)% |
|
30 |
% |
|
58 |
% |
|
|
|
(27 |
)% |
||
In regard to forward looking non-IFRS guidance, we are not able to reconcile the forward-looking non-IFRS Adjusted EBITDA measure to the closest corresponding IFRS measure without unreasonable efforts because we are unable to predict the ultimate outcome of certain significant items including, but not limited to, fair value movements, share-based payments for future awards, acquisition-related expenses and certain financing and tax items.
Free Cash Flow
Free Cash Flow is a non-IFRS financial measure defined as cash flow from operating activities less capital expenditures, or CAPEX.
We believe Free Cash Flow is useful to our management as a measure of financial performance as it measures our ability to generate additional cash from our operations. While we use Free Cash Flow as a tool to enhance our understanding of certain aspects of our financial performance, we do not believe that Free Cash Flow is a substitute for, or superior to, the information provided by IFRS metrics. As such, the presentation of Free Cash Flow is not intended to be considered in isolation or as a substitute for any measure prepared in accordance with IFRS.
The primary limitation associated with the use of Free Cash Flow as compared to IFRS metrics is that Free Cash Flow does not represent residual cash flows available for discretionary expenditures due to the fact that the measure does not deduct the payments required for debt service and other obligations or payments made for business acquisitions. Free Cash Flow as we define it also may not be comparable to similarly titled measures used by other companies in the online gambling affiliate industry.
Below is a reconciliation to Free Cash Flow from cash flows generated by operating activities as presented in the Unaudited Interim Condensed Consolidated Statement of Cash Flows for the period specified:
|
|
Three Months Ended June 30, |
|
CHANGE |
|
Six Months Ended June 30, |
|
CHANGE |
||||||||||||||||
|
|
2022 |
|
2021 |
|
$ |
|
% |
|
2022 |
|
2021 |
|
$ |
|
% |
||||||||
|
|
(in thousands USD, unaudited) |
|
|
|
|
|
(in thousands USD, unaudited) |
|
|
|
|
||||||||||||
|
Cash flows generated by operating activities |
3,460 |
|
|
4,738 |
|
|
(1,278 |
) |
|
(27 |
)% |
|
6,944 |
|
|
11,478 |
|
|
(4,534 |
) |
|
(40 |
)% |
|
Capital Expenditures (1) |
(546 |
) |
|
(1,616 |
) |
|
1,070 |
|
|
66 |
% |
|
(2,758 |
) |
|
(1,959 |
) |
|
(799 |
) |
|
(41 |
)% |
|
Free Cash Flow |
2,914 |
|
|
3,122 |
|
|
(208 |
) |
|
(7 |
)% |
|
4,186 |
|
|
9,519 |
|
|
(5,333 |
) |
|
(56 |
)% |
|
(1) |
Capital expenditures are defined as the acquisition of property and equipment and the acquisition of intangible assets. |
Powered by WPeMatico


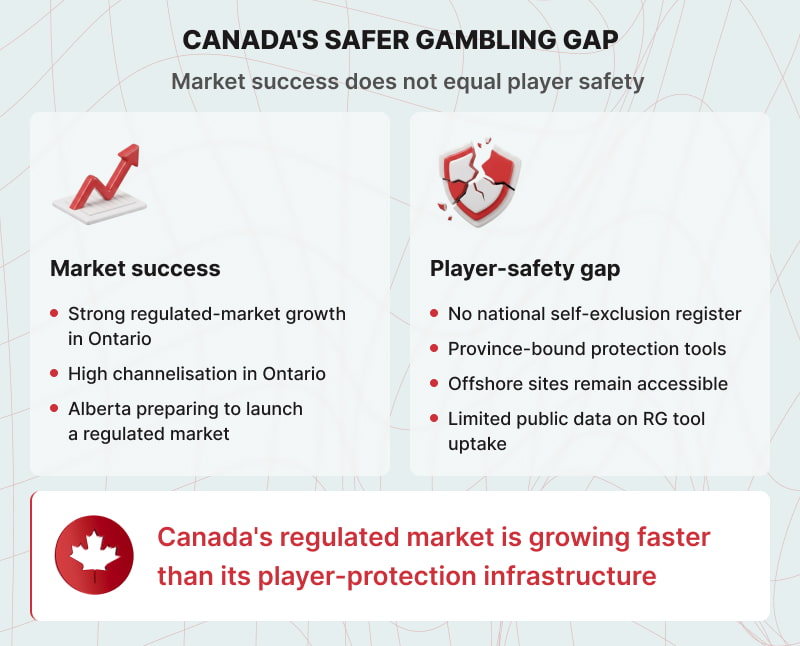
Canada’s online gambling market is the third-largest in the world. It generated approximately CAD 13.15 billion in 2025, growing faster than virtually any other country. By the metrics the industry tends to reach for, it is a success story.
Unfortunately, where many of the metrics that matter for player protection are concerned, the story is different. Unlike several other countries, Canada has no national self-exclusion register and no national licensing framework.
While Ontario is regulated, and there is a lot of excitement around Alberta opening its regulated market this summer, the overwhelming majority of online gambling in the country still happens on unlicensed platforms.
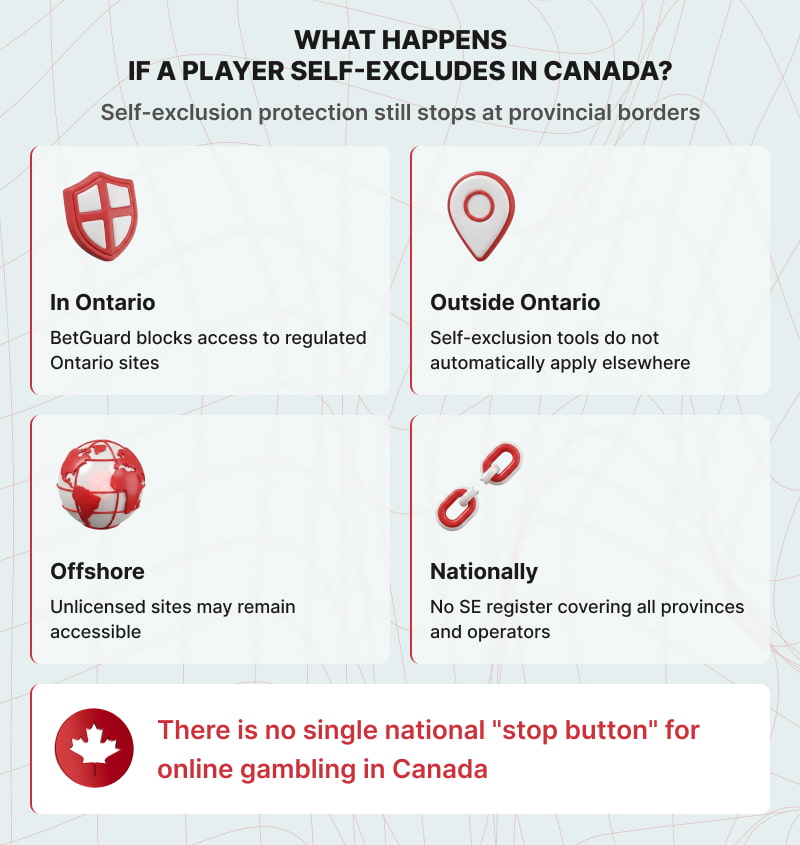
An Ontario or Alberta player who self-excludes still can gamble through offshore sites or outside the province. Canada has no single stop button.
Key Findings
- Canada has no national self-exclusion register, no national licensing framework, and the last national survey predates the legalisation of single-event sports betting.
- Offshore leakage outside Ontario ranges from 49% to 93% by province. The offshore market grew at 40% year-on-year in 2025.
- Ontario has a 91.1% channelisation rate, but 20.2% of players also play on unregulated sites.
- Player awareness of RG tools in Ontario stands at 65.4%, according to iGO’s own Leger survey baseline. No province publishes data on actual tool uptake rates.
- A CMAJ study found gambling helpline contacts in Ontario rose 198% after market privatisation, concentrated almost entirely in men aged 15 to 44.
A Fragmented System
Canada’s gambling framework is a product of its constitution. Sections 91 and 92 of the Constitution Act distribute authority to the provinces, and Section 207 of the Criminal Code permits them to conduct and manage lottery schemes within their own borders. A 1985 federal-provincial agreement completed the transfer, leaving Ottawa without a gambling regulator and the country without national standards of any kind.
The result is ten parallel regimes, all operating at different standards. Ontario operates an open market, and Alberta is building a similar structure. Every other province runs a government monopoly: BCLC’s PlayNow, Loto-Quebec’s Espace-jeux, and the Atlantic Lottery Corporation.
The issue is that there is no connection between these. A responsible gambling tool in one province has no power in another. A self-exclusion registered in Ontario does not block a player from gambling elsewhere.
Changes do not appear to be on the horizon, with no federal legislation on those issues currently before Parliament.
The Offshore Risks
The Blask 2025 USA and Canada iGaming Landscape Report highlights the scale of this problem. Saskatchewan carries an estimated 93% offshore leakage rate. Alberta and Manitoba sit at 88%. Quebec, where Loto-Quebec has operated since 2010, holds only around 17% of a market estimated at CAD 2.3 billion.
Even British Columbia, with years of PlayNow operations behind it, retains approximately 49-51% of its online market, according to Blask’s reports. Offshore platforms grew at 40% year-on-year in 2025, nearly double the 23% growth of domestic licensed operators.
Ontario’s Success and Limits
Ontario deserves genuine credit for its current position, and it is often hailed as an example of a strong regulatory market.
The regulated market generated CAD 82.7 billion in wagers and CAD 2.9 billion in gross gaming revenue in FY2024/25. Channelisation, measured by the share of online gamblers using regulated platforms, reached 83.7% in early 2025 and 91.1% on the most recent IPSOS survey.
However, the Ontario story is often viewed as the national story, and this is not the case. Even within the province, 20.2% of players using regulated platforms also gamble on unregulated sites.
BetGuard, launched in May 2026, finally delivered the centralised self-exclusion system that the market should have had from day one, allowing a player to exclude from all regulated platforms at once.
The early take-up numbers show more than 500 people registered for BetGuard in its first two weeks. That is not a negligible start, and iGaming Ontario has stated it will measure the platform’s success by renewal rates, term lengths selected, and connections to addiction support services.
However, Ontario’s market has 1.235 million active player accounts. The gap between the scale of the regulated market and the early uptake of the tool is wide.
The deeper problem is that BetGuard is province-bound. A player who is excluded in Ontario is not blocked elsewhere.
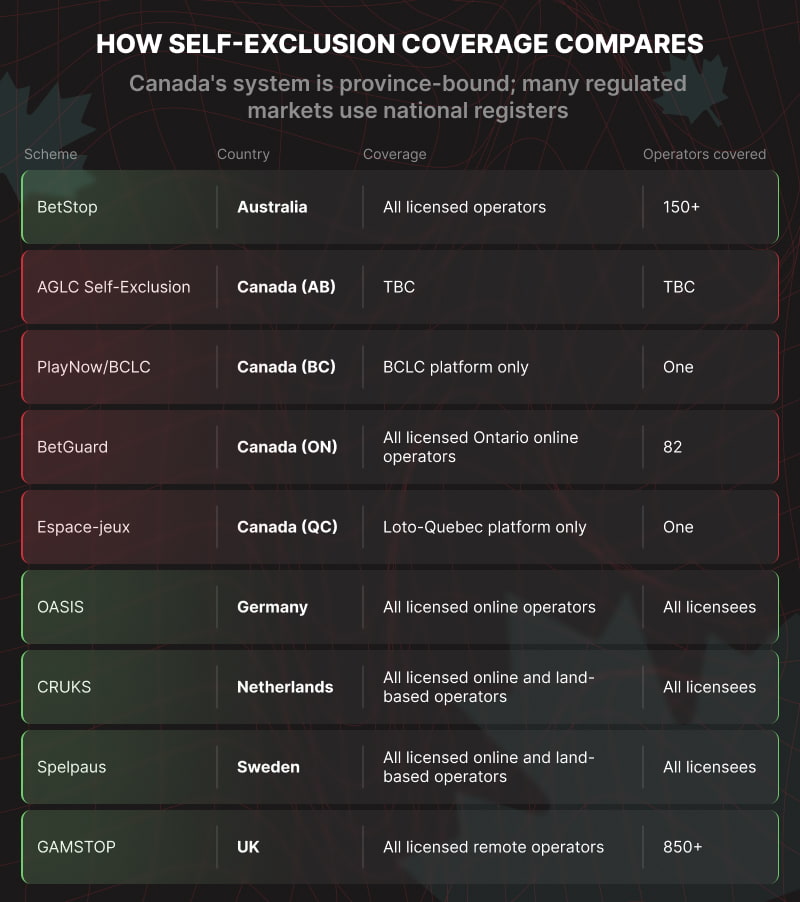
Many other countries have solved this problem. GAMSTOP in the UK covers all licensed remote operators under a single registration. Spelpaus in Sweden does the same across online and land-based channels. BetStop in Australia covers approximately 150 licensed wagering providers with a five-minute sign-up.
Canada has no equivalent, and there is currently no route to making one.
What the Evidence Says
The academic case for nationally coordinated self-exclusion is strong. A comparative review of self-exclusion programmes across multiple jurisdictions found that the reach and enforcement of any scheme vary directly with how completely it covers the market.
A review of BCLC’s voluntary self-exclusion programme found that 97% of participants who gambled while excluded did so at venues not covered by their agreement. The exclusion worked where it applied, but not beyond that.
The tool-uptake literature is equally sobering. Studies analysing voluntary deposit-limit setting across large player populations find uptake rates in the low single digits over three-month periods. Ontario does not publish equivalent figures, but iGO’s own Leger survey in 2024 found that only 65.4% of regulated players were aware of available RG tools.
The gap between knowing a tool exists and using it is consistently wide, and no regulator publishes data on actual tool engagement rates. That absence is itself a significant accountability problem.
Where public health data does exist, it is alarming. British Columbia’s 2025/26 prevalence study found that 35% of past-year online gamblers showed moderate or high-risk behaviour.
The most striking recent evidence comes from a January 2026 CMAJ study analysing contacts with Ontario’s ConnexOntario helpline over thirteen years.
The study found that gambling-related contacts increased from a monthly rate of 13.4 per million before online gambling launched, to 17.0 after PlayOLG’s introduction, to 26.2 following the market opening in April 2022.
The increases occurred almost exclusively in adolescent boys and men aged 15 to 44, with the 15-to-24 age group estimated to have seen contacts rise by 337.8%.
A regulated market that generates record-breaking wagers and a near-200% increase in gambling-related helpline contacts simultaneously is simply demonstrating that market growth and player protection are not the same thing.
The Future
Alberta’s launch will introduce centralised self-exclusion from day one, requiring all registered operators to integrate with AGLC’s self-exclusion programme as a condition of registration.
This is a huge step in the right direction, but, like BetGuard, it will still be province-bound.
The case for a shared register is strong. Licensed operators are also competing with offshore threats. A functioning national self-exclusion infrastructure, combined with the channelisation benefits that a well-regulated market delivers, serves their commercial interests as directly as it serves players’ welfare.
If Canada is going to solve its responsible gambling issues, it needs to admit that the fragmented framework has shortcomings in customer care and stop using Ontario’s success as a stand-in for the country as a whole.
The post Canada’s Safer Gambling Gap: Why Market Success Doesn’t Always Equal Player Safety appeared first on Americas iGaming & Sports Betting News.

Supplier content is already live on BetMGM in Ontario, with Party Casino & Sports Interaction lined up ahead of Alberta’s July iGaming opening.
Gaming Corps has expanded its partnership with Entain, extending distribution of its casino content across more Entain brands and markets, with Canada positioned as a key near-term focus.
The supplier went live with Entain’s joint venture BetMGM in Ontario in December 2025, followed by a wider Entain rollout in the province in March 2026. Gaming Corps and Entain are also preparing for Alberta’s regulated iGaming market opening in July, with Gaming Corps content “ready to go live from day one with BetMGM” and Party Casino & Sports Interaction to follow.
Outside Canada, Gaming Corps said it completed a full content launch in Brazil with Sportingbet and Betboo in May, and launched 3 Pigs of Olympus exclusively across Entain’s UK-facing Ladbrokes, Coral Gala and Foxy brands in June. The company also said additional launches are being prepared for Portugal, Spain and New Zealand.
The latest phase includes football-themed titles such as Penalty Champion, Goals to Glory: Football Fever and Goals to Glory: Instant Blitz, alongside the supplier’s 3 Pigs IP. Graham Greensmith, Chief Commercial Officer at Gaming Corps, said: “For Gaming Corps, this is a huge milestone. Entain is one of the biggest names in global gaming, so to see our relationship grow in this way is a clear sign of the trust, performance and commercial value we have built together.
“What makes this particularly exciting is the scale of the opportunity. This is not a single-brand launch or a one-market rollout. Entain is continuing to take Gaming Corps content into more territories, across more of its brands, and that says a lot about where we are as a business.
“We have worked hard to build a portfolio that gives major operators real flexibility, from high-performing IP to timely, event-led content and new game formats. To see that strategy being recognised by a partner of Entain’s calibre is incredibly rewarding, and we are very excited about what comes next.”
Obdulio Bacarese, Global Gaming Director at Entain, added: “Gaming Corps has been a valuable partner over the last four years. The strength of the relationship lies in how easily the content can be activated around different commercial priorities, from supporting new market entries to adding timely releases around key calendar moments. The studio understands the need for content that is flexible, relevant and easy to position locally, and we are pleased to continue building on the partnership.”
The post Gaming Corps expands Entain deal with Ontario live and Alberta launch planned appeared first on EE Gaming | Global iGaming & Tech Intelligence Hub.

Gaming Corps, a publicly listed game development company based in Sweden, has expanded its partnership with Entain, one of the world’s largest sports betting and gaming groups, marking the latest phase of a relationship that began with the companies’ original partnership agreement in 2022 and now spans multiple Entain brands.
Canada is a major focus for the extended partnership. Gaming Corps went live with Entain’s Joint Venture, BetMGM in Ontario in December 2025, followed by a wider Entain rollout in the province in March 2026. Both are now preparing for the opening of Alberta’s regulated iGaming market in July, with the studio’s content ready to go live from day one with BetMGM and Party Casino & Sports Interaction following shortly after.
The partnership has also continued to grow internationally, with Gaming Corps completing a full content launch in Brazil with Sportingbet and Betboo in May of this year, followed by the exclusive launch of 3 Pigs of Olympus across Entain’s UK-facing Ladbrokes, Coral Gala and Foxy brands in June.
Additional market launches in Portugal, Spain and New Zealand are also being prepared.
The latest phase includes a mix of Gaming Corps’ most recognisable content, from football-themed titles such as Penalty Champion, Goals to Glory: Football Fever and Goals to Glory: Instant Blitz, to the studio’s high-performing 3 Pigs IP.
Graham Greensmith, Chief Commercial Officer at Gaming Corps, said: “For Gaming Corps, this is a huge milestone. Entain is one of the biggest names in global gaming, so to see our relationship grow in this way is a clear sign of the trust, performance and commercial value we have built together.
“What makes this particularly exciting is the scale of the opportunity. This is not a single-brand launch or a one-market rollout. Entain is continuing to take Gaming Corps content into more territories, across more of its brands, and that says a lot about where we are as a business.
“We have worked hard to build a portfolio that gives major operators real flexibility, from high-performing IP to timely, event-led content and new game formats. To see that strategy being recognised by a partner of Entain’s calibre is incredibly rewarding, and we are very excited about what comes next.”
Obdulio Bacarese, Global Gaming Director at Entain, added: “Gaming Corps has been a valuable partner over the last four years. The strength of the relationship lies in how easily the content can be activated around different commercial priorities, from supporting new market entries to adding timely releases around key calendar moments. The studio understands the need for content that is flexible, relevant and easy to position locally, and we are pleased to continue building on the partnership.”
The post Gaming Corps expands Entain partnership with major Canadian rollout appeared first on Americas iGaming & Sports Betting News.

-

 Affiliate Industry6 days ago
Hub Affiliations Triumphs at the iGB Affiliate Awards 2026: Winner of Programme/Network Campaign of the Year
-
Austria6 days ago
Austrian Brand Value Study: NOVOMATIC Defends Top Ranking
-
Latest News6 days ago
N1 Partners at iGB L!VE 2026: Bringing Together Affiliates, Art and Innovation
-
Amusnet6 days ago
Amusnet Releases its Latest Video Slot “Golden Snake”
-
Africa6 days ago
PopOK Gaming sponsors Botswana’s TT Cup Challenge horse racing event
-
Betsson CEO Pontus Lindwall6 days ago
Gaming in the Nordics launch event sets annual Copenhagen conference from 2027
-
Azerbaijani Parliament6 days ago
Azerbaijan to Impose Tougher Penalties for Illegal Online Gambling
-
Amusnet6 days ago
Weekend Reels | Week 27: Slot Drops & Trends