
Latest News
INTRALOT announces First Quarter 2022 Financial Results


INTRALOT SA (RIC: INLr.AT, Bloomberg: INLOT GA), an international gaming solutions and operations leader, announces its financial results for the three-month period ended March 31st, 2022, prepared in accordance with IFRS.
OVERVIEW
Group Revenue at €97.7m in 1Q22 (+0.1% y-o-y).
EBITDA in 1Q22 at €26.1m (+4.9% y-o-y).
NIATMI (Net Income After Tax and Minority Interest) from continuing operations at €-5.7m, vs.
€-6.9m a year ago.
Greek entities OPEX better by 12.5% y-o-y.
Operating Cash Flow at €17.3m in 1Q22.
Group Net CAPEX in 1Q22 was €4.3m.
Group Cash at the end of 1Q22 at €98.0m.
Net Debt at €500.6m at the end of 1Q22.
Net Debt/ LTM EBITDA at 4.5x in 1Q22.
On April 26, 2022, INTRALOT announced that it will convene a shareholders’ meeting to approve a Share Capital Increase of the Company via a rights issue, up to an amount not exceeding the 150% of the paid-up share capital. The proceeds will be used to purchase the shares in Intralot Inc. currently not controlled by the parent Group. To this end a binding Sale Purchase Agreement has been signed with the minority shareholders controlling 33.2m shares of Intralot Inc. for a price of €3.65 per share, conditional upon successful completion of the Share Capital Increase. INTRALOT announced that it has signed a binding MOU with Standard General Master Fund II L.P., according to which Standard General will purchase all unallocated shares in the Share Capital Increase, up to a number not exceeding one third of the total voting shares of Intralot SA for up to €0.58 per share.
On May 23, 2022, an extraordinary Shareholders’ Meeting provided authorization to the Board of Directors of Intralot SA to determine the terms of the Share Capital Increase and undertake all necessary actions.
Note:
Due to rounding, numbers presented throughout this and other documents may not add up precisely to the totals.
Group Headline Figures
| (in € million) | 1Q22 | 1Q21 | % | LTM | ||
| Change | ||||||
| Revenue (Turnover) | 97.7 | 97.6 | 0.1% | 414.1 | ||
| GGR | 79.8 | 78.9 | 1.2% | 336.2 | ||
| OPEX1 | (21.8) | (22.1) | -1.2% | (101.4) | ||
| EBITDA2 | 26.1 | 24.9 | 4.9% | 111.7 | ||
| EBITDA Margin | 26.7% | 25.5% | + 1.2pps | 27.0% | ||
| (% on Revenue) | ||||||
| EBITDA Margin | 32.7% | 31.6% | + 1.1pps | 33.2% | ||
| (% on GGR) | ||||||
| Capital Structure Optimization | (0.3) | (5.0) | -93.9% | (12.4) | ||
| expenses | ||||||
| D&A | (17.1) | (15.9) | 7.3% | (72.2) | ||
| EBT | (2.3) | (2.8) | 17.5% | 37.6 | ||
| EBT Margin (%) | -2.4% | -2.9% | + 0.5pps | 9.1% | ||
| NIATMI from continuing operations | (5.7) | (6.9) | 17.9% | 27.8 | ||
| Total Assets | 580.5 | 612.1 | – | – | ||
| Gross Debt | 598.6 | 734.3 | – | – | ||
| Net Debt | 500.6 | 643.7 | – | – | ||
| Operating Cash Flow from total | 17.3 | 24.5 | -29.6% | 100.4 | ||
| operations | ||||||
| Net CAPEX | (4.3) | (2.9) | 47.3% | (24.3) | ||
INTRALOT Chairman & CEO Sokratis P. Kokkalis noted:
“First quarter results show a consolidation of gains and recovery from the COVID impact and reflect an improved financial profile, with normalized revenues and a reduction in operational expenses and debt servicing costs consistent with the Company’s business plan. On the background of this strongly improved P/L and Balance Sheet, the Company has designed and is about to launch a Share Capital Increase by means of Rights Issue and has secured the commitment of Standard General Master Fund
- P. as cornerstone investor for the unsubscribed rights in a move that will significantly strengthen our prospects to grasp the tremendous opportunities in the US and the global markets.”
- OPEX line presented excludes the capital structure optimization expenses.
- The Group defines “EBITDA” as “Operating Profit/(Loss) before tax” adjusted for the figures “Profit/(loss) from equity method consolidations”, “Profit/(loss) to net monetary position”, “Exchange Differences”, “Interest and related income”, “Interest and similar expenses”, “Income/(expenses) from participations and investments”, “Write-off and impairment loss of assets”, “Gain/(loss) from assets disposal”, “Reorganization costs” and “Assets’ depreciation and amortization”.
OVERVIEW OF RESULTS
REVENUE
Reported consolidated revenue posted a steady performance compared to 1Q21, leading to total revenue for the three-month period ended March 31st, 2022, of €97.7m (+0.1%).
- Lottery Games was the largest contributor to our top line, comprising 61.9% of our revenue, followed by Sports Betting which contributed 18.8% to Group turnover for the three-month period. Technology contracts accounted for 7.7% and VLTs monitoring represented 11.2% of Group turnover, while Racing constituted the 0.5% of total revenue.
- Reported consolidated revenue for the three-month period is higher only by €0.1m year over year. The main factors behind the steady top line performance per Business Activity are:
- €+1.8m (+6.1%) from our Licensed
Operations (B2C) activity line with the variance driven by:
- Higher revenue in Argentina (€+2.5m or +32.0% y-o-y), driven by local market growth. In local currency, current year results posted a +50.4% y-o-y increase, and
- Lower revenue in Malta (€-0.6m or -2.9% y-o-y), driven by market performance.
- €+0.7m (+1.3%) from our Technology and Support Services (B2B/ B2G) activity line, with the variance driven by:
- Higher revenue in Australia (€+1.1m or +30.6% y-o-y), due to lockdown restrictions in 1Q21,
- Higher revenue in Croatia (€+0.9m), following the go-live of the lottery solution developed for Hrvatska Lutrija (national lottery of Croatia),
- Higher revenue from other jurisdictions (€+0.5m) mainly due to services related sales, and
- Lower revenue in US operations (€-1.9m or -5.1% y-o-y), was primarily affected by the nonrecurrence of the jackpot that boosted 1Q21 sales by c. €4.0m. Revenue from services ended lower by -3.4% y-o-y, while revenue from merchandise sales generated a deficit of -55.4% y-o-y due to their less frequent nature. From a currency perspective, there was a positive impact of 6.9% (Euro depreciation versus a year ago — in average terms).
- €-2.4m (-18.3%) from our
Management (B2B/ B2G) contracts activity line with the variance driven by:
- Slightly higher revenue in Morocco (€+0.1m),
- Marginally higher revenue from our US Sports Betting contracts in Montana and Washington, D.C. (€+0.1m), and
- Lower revenue from our Turkish operations (€-2.6m), solely affected by the appreciation of EUR (+75.8% versus a year ago – in average terms). In local currency, current year results posted a +20.4% y-o-y increase. In 1Q22, the local Sports Betting market expanded close to 1.3 times y-o-y, with the online segment representing close to 89% of the market at the end of 1Q22.
- Constant currency basis: In 1Q22, revenue — net of the negative FX impact of €3.8m —reached €101.4m (+4.0% y-o-y).
GROSS GAMING REVENUE & Payout
- Gross Gaming Revenue (GGR) from continuing operations concluded at €79.8m in 1Q22, posting an increase of 1.2% (or €+0.9m) year over year, attributable to:
- the decrease in the non-payout related GGR (-1.7% y-o-y or €-1.2m vs. 1Q21), driven mainly by the lower top line contribution of our US operations (jackpot affected), followed by
- the increase in the payout related GGR (+20.2% y-o-y or €+2.1m vs. 1Q21), driven mainly by the lower average payout ratio both in Malta and Argentina (+4.3% y-o-y on wagers from licensed operations3). 1Q22 Average Payout Ratio4 decreased by 5.4pps vs. 1Q21 (58.9% vs. 64.4%), significantly affected by the higher weighted contribution from our operations in Malta.
- Constant currency basis: In 1Q22, GGR — net of the negative FX impact of €3.1m — reached €82.9m (+5.1% y-o-y).
- Licensed Operations Revenue also include a small portion of non-Payout related revenue, i.e., value-added services, which totaled €1.3m and €0.8m for 1Q22 and 1Q21respectively.
- Payout ratio calculation excludes the IFRS 15 impact for payments to customers.
OPERATING EXPENSES5 & EBITDA6
- Total Operating Expenses ended lower by €0.3m (or -1.2%) in 1Q22 (€21.8m vs. €22.1m). After excluding the higher D&A expenses (€0.7m) in USA, Morocco and Croatia, Operating Expenses ended lower by €0.9m supported by cost containments in HQ perimeter.
- Other Operating Income from continuing operations ended at €5.7m presenting an increase of 3.2% y-o-y (or €+0.2m). The bulk of income is driven by the equipment leases in the USA.
- EBITDA from continuing operations amounted to €26.1m in 1Q22, posting an increase of 4.9% (or €+1.2m) compared to 1Q21. Despite the absence of jackpot that boosted significantly 1Q21 performance (US operations), the Group has managed to improve its EBITDA via the combined effect of the lower payout from our licensed operations and the lower Operating Expenses.
- On a yearly basis, EBITDA margin on sales improved to 26.7%, compared to 25.5% in 1Q21 (+1.2pps).
- LTM EBITDA stands at €7m.
- Constant currency basis: In 1Q22, EBITDA, net of the negative FX impact of €1.4m, reached €27.5m (+10.5% y-o-y).
EBT / NIATMI
EBT in 1Q22 totaled €-2.3m, compared to €-2.8m in 1Q21, with the variance driven by:
- the lower reorganization expenses following the succesful conclusion of our capital structure optimization process (€+4.7m vs 1Q21),
- the lower interest expenses, direct effect of debt restructuring (€+1.9m vs 1Q21)
- the positive impact from EBITDA (€+1.2m vs 1Q21)
The major headwinds affecting the improved perfornance can be attributed to:
- the negative impact from FX results (€-4.2m vs 1Q21), as a result of the valuation of cash balances in foreign currency other than the functional currency of each entity, the valuation of commercial and borrowing liabilities of various subsidiaries abroad in EUR, as well as the negative effect from the reclassification of FX reserves to Income Statement applying IFRS 10,
- the recognition of expenses vs income from participations and investments (€-1.5m vs 1Q21),
- the higher D&A (€-1.2m vs 1Q21), mainly due to Turkey (Bilyoner) and Morocco
- the accounting loss identified due to IAS 29 in our Argentinian operations (€-1.1m vs 1Q21).
Constant currency basis: In 1Q22 EBΤ, adjusted for the FX impact, reached €-0.4m, from €-6.5m in 1Q21.
- NIATMI from continuing operations in 1Q22 concluded at €-5.7m compared to €-6.9m in 1Q21. NIATMI from total operations in 1Q22 amounted to €-5.7m (improved by €2.6m vs. a year ago), including the performance of the discontinued operations in Peru and Brazil.
- Constant currency basis: NIATMI (total operations) in 1Q22, on a constant currency basis, reached €-5.3m from €-12.1m in 1Q21.
- Operating Expenses analysis excludes expenditures related to capital structure optimization.
- EBITDA analysis excludes Depreciation & Amortization, and expenditures related to capital structure optimization.
CASH-FLOW
- Operating Cash-flow in 1Q22 amounted to €17.3m, lower by €7.3m, compared to 1Q21. Excluding the operating cash-flow contribution of our discontinued operations in Brazil, the cash-flow from operating activities is lower by €7.0m vs. a year ago and is attributed to Income Tax payments vs returns 1Q21.
- Adjusted Free Cash Flow7 in 1Q22 decreased by €2.9m to €1.7m, compared to €4.6m a year ago. The main negative contributors to this variance were the income tax paid vs return in 1Q21 (€-7.4m y-o-y) and the higher maintenance capex (€-1.8m). On positive ground, dividends paid during the period were lower (€+3.1m y-o-y), net finance charges following the capital restructuring generated savings (€+2.0m y-o-y) and EBITDA performance has been improved (€+1.2m y-o-y).
- Net CAPEX in 1Q22 was €4.3m, higher by €1.4m compared to 1Q21. CAPEX in 1Q22 has been allocated towards R&D and project pipeline delivery (€0.3m), US (€3.0m) and the rest of operations (€1.0m). Maintenance CAPEX accounted for €2.2m, or 52.0% of the overall capital expenditure in 1Q22, from €0.8m or 28.2% in 1Q21.
- Net Debt, as of March 31st, 2022, stood at €500.6m, increased by €3.4m compared to December 31st, 2021 (€497.2m). The Net Debt increase was impacted primarily by the normal course of business following an adverse working capital movement, the exchange rate differences
(€+4.7m) for our USD denominated debt, and investments in growth capex (€+1.4m) for our US operations. The increase was partially offset by the lower interest accrued over 1Q22 vs December 2021.
- Calculated as EBITDA – Maintenance CAPEX – Cash Taxes – Net Cash Finance Charges (excluding refinancing charges) – Net Dividends Paid; all finance metrics exclude the impact of discontinued operations.
OUTLOOK
Although the risks associated with the pandemic of COVID-19 have been downgraded, the geopolitical tension arising from the war in Ukraine coupled with the energy crisis, the supply chain disruptions and the rising inflation are factors that are expected to determine the economic outlook over the coming months.
Our Group does not have direct exposure in terms of operations or dependency on suppliers in Ukraine and Russia. However, the risk of indirect effects on the Group’s business activities from the reduction in the household disposable income and the possible increase in operating expenses due to inflationary pressures cannot be overlooked.
The Management of the Company monitors the geopolitical and economic developments on a constant basis and is ready to take all the necessary measures for protecting its operations.
RECENT/ SIGNIFICANT COMPANY DEVELOPMENTS
- On April 26, 2022, INTRALOT announced that it will convene a shareholders’ meeting to approve a Share Capital Increase of the Company via a rights issue, up to an amount not exceeding the 150% of the paid-up share capital. The proceeds will be used to purchase the shares in Intralot Inc. currently not controlled by the parent Group. To this end a binding Sale Purchase Agreement has been signed with the minority shareholders controlling 33,227,256 ordinary shares of Intralot Inc. for a price of €3.65 per share, conditional upon successful completion of the Share Capital Increase. INTRALOT announced that it has signed a binding MOU with Standard General Master Fund II L.P., according to which Standard General will purchase all unallocated shares in the Share Capital Increase, up to a number not exceeding one third of the total voting shares of Intralot SA for up to €0.58 per share.
- On May 23, 2022, an extraordinary Shareholders’ Meeting provided authorization to the Board of Directors of Intralot SA to determine the terms of the Share Capital Increase and undertake all necessary actions.
APPENDIX
Performance per Business Segment8
YTD Performance
Performance per Geography
Revenue Breakdown
| (in € million) | 1Q22 | 1Q21 | % | ||
| Change | |||||
| Europe | 35.8 | 34.4 | 4.0% | ||
| Americas | 52.3 | 50.5 | 3.4% | ||
| Other | 15.3 | 16.8 | -8.9% | ||
| Eliminations | (5.7) | (4.2) | – | ||
| Total Consolidated Sales | 97.7 | 97.6 | 0.1% |
Gross Profit Breakdown
| (in € million) | 1Q22 | 1Q21 | % | ||
| Change | |||||
| Europe | 3.5 | (1.7) | – | ||
| Americas | 11.4 | 13.8 | -17.5% | ||
| Other | 13.0 | 14.2 | -8.4% | ||
| Eliminations | (2.7) | (0.7) | – | ||
| Total Consolidated Gross Profit | 25.2 | 25.6 | -1.6% |
- Part of the US revenue that concerns SB management, has been included under the category “Game Management”. The rest of the US revenue is included under the “Technology” business segment.
| Gross Margin Breakdown | ||||||
| % | ||||||
| 1Q22 | 1Q21 | |||||
| Change | ||||||
| Europe | 9.8% | -5.1% | + 14.8pps | |||
| Americas | 21.8% | 27.4% | – 5.5pps | |||
| Other | 84.8% | 84.4% | + 0.4pps | |||
| Total Consolidated Gross Margin | 25.8% | 26.2% | – 0.4pps | |||
INTRALOT Parent Company results
- Revenue for the period increased by 28.1%, to €6.0m, with the improvement driven by the higher rendering of services towards the Group’s subsidiaries in the current period.
- EBITDA shaped at €-1.3m from €-4.5m in 1Q21, with the positive variance stemming from the top-line improvement that generated higher profitability due to better margins and lower costs.
- Earnings after Taxes (EAT) at €-6.7m from €-0.1m in 1Q21, impacted mainly by the gain recorded in 1Q21 following the sale of Intralot de Peru.
| (in € million) | 1Q22 | 1Q21 | % | ||
| Change | |||||
| Revenue | 6.0 | 4.6 | 28.1% | ||
| Gross Profit | (0.5) | (3.1) | -82.9% | ||
| Other Operating Income9 | 0.1 | 0.0 | – | ||
| OPEX9 | (4.5) | (5.1) | -11.8% | ||
| EBITDA9 | (1.3) | (4.5) | 71.5% | ||
| EAT | (6.7) | (0.1) | – | ||
| CAPEX (paid) | (0.3) | (0.5) | -35.4% |
- Other Operating Income, Operating Expenses and EBITDA lines presented exclude the expenditures and recharges related to capital structure optimization.
CONFERENCE CALL INVITATION – 1Q22 FINANCIAL RESULTS
Sokratis Kokkalis – Chairman & CEO, Chrysostomos Sfatos – Deputy Group CEO, Nikolaos Nikolakopoulos – Deputy Group CEO, Fotis Konstantellos – Deputy Group CEO, Andreas Chrysos – Group CFO, Nikolaos Pavlakis – Group Tax & Accounting Director, Antonis Skiadas – Group Finance, Controlling & Budgeting Director and Michail Tsagalakis – Capital Markets Director, will address INTRALOT’s analysts and institutional investors to present the Company’s 1Q22 results, as well as to discuss the latest developments at the Company.
Powered by WPeMatico



Every month, N1 Insights features N1 Partners experts sharing their perspective on the latest developments in the iGaming industry. But these insights are only part of the bigger picture. Behind every prediction lies market analysis, hands-on experience, and real-world cases that deserve a deeper discussion.
That’s why we’re launching N1 Beyond the Insights — a new series where N1 Partners experts take a closer look at the industry’s most important topics, share in-depth analysis, and explore the nuances that help affiliates make better traffic decisions.
In our first edition, we focus on Facebook: the seasonal shifts that typically occur in July, the metrics that matter most, and why evaluating campaign performance requires looking beyond surface-level results and analyzing the entire user journey.
False Signals: When a Drop in CTR and CR Doesn’t Mean Your Campaign Is Failing
In July, traditional advertising metrics can be misleading — even for experienced media buyers. One of the most common mistakes is treating a decline in CTR and CR as a clear sign that a campaign has burned out and should be turned off.
In reality, the cause is often a seasonal shift in user behaviour rather than the campaign itself. During the summer, people spend more time on mobile devices, travel more, and generally devote less attention to social media. They scroll through their feeds faster, which naturally leads to lower CTR and registration conversion rates, even when the campaign continues to attract high-quality traffic.
This is where many affiliates make costly mistakes. They see performance drop in their tracker, pause campaigns that are still delivering value, and start testing new creatives, spending additional budget to solve a problem that may not actually exist.
The N1 Partners Approach
In situations like these, the N1 Partners team avoids drawing conclusions based solely on the first signs of declining advertising metrics.
Instead, we look at the full picture by analysing:
- user cohorts;
- the time between registration and first deposit;
- post-click user behaviour;
- overall campaign profitability.
During the summer, it’s especially important to allow the entire conversion cycle to unfold before evaluating performance. A user may click on an ad during the day but only complete registration or make a first deposit later that evening or even over the weekend.
Our team also recommends adapting creatives to seasonal user behaviour. Shorter funnels, clear messaging, and offers built around fast or instant-play games tend to perform better during the summer, as they require less time and commitment from users who are often browsing on the go.
Night-Time Traffic: Why a Lower CPC Doesn’t Always Mean Higher ROI
Another seasonal trend in July is the shift in user activity patterns.
Across many Tier-1 markets, longer daylight hours and warmer weather change how people spend their time. Users are generally less active on social media during the day, with engagement gradually moving into the late evening and overnight hours.
Facebook adapts quickly to these behavioural changes, allocating more impressions during peak activity periods — typically between 10:00 PM and 3:00 AM local time.
For affiliates, this can initially look like an opportunity:
- lower CPC;
- higher traffic volume;
- more registrations.
However, these metrics don’t necessarily translate into better campaign performance. A lower acquisition cost doesn’t automatically mean higher-quality traffic or stronger long-term profitability, which is why it’s important to evaluate the full conversion funnel rather than relying on CPC alone.
| What the Ads Manager Shows | What’s Actually Happening |
| Lower CPC | Users are more likely to browse their feeds without taking action. |
| More Registrations | A smaller share of users progresses to making a quality first deposit. |
| Higher traffic volume | More registrations fail to convert into long-term revenue. |
During late-night hours in Tier-1 markets, additional factors can affect deposit conversion:
- users may reach their daily card spending limits;
- banks often perform scheduled maintenance and security updates overnight;
- declined payment rates tend to increase.
As a result, affiliates may see a high number of registrations while the conversion rate from registration to first deposit declines.
The N1 Partners Approach
At N1 Partners, we don’t recommend limiting campaigns to night-time hours through dayparting simply because CPC appears lower.
While daytime traffic is often more expensive, users acquired during the day and early evening are generally more likely to complete meaningful deposits and deliver stronger long-term value. Rather than optimizing for the lowest acquisition cost, we recommend evaluating traffic quality across the entire conversion funnel and optimizing for overall campaign profitability.
Metrics That Help You Spot Problems Before Your Competitors
Today, Facebook campaign analysis goes far beyond CTR, CPC, and registration volume. If a campaign continues to generate high-quality traffic while ROI starts to decline, the issue isn’t necessarily on Facebook’s side.
At N1 Partners, one of the earliest warning signs we monitor is payment infrastructure performance. Changes in payment metrics often reveal underlying issues before they become visible in overall campaign results.
The first metrics we analyze include:
| Metric | What It Indicates |
| Success Rate | The share of successful payments compared to failed transactions. |
| Decline Rate | Whether payment failures are increasing over time. |
| Reg-to-Dep | How efficiently registrations convert into first-time depositors. |
| FTD | First deposit |
During the summer, banks in Tier-1 markets regularly update their payment gateways, adjust transaction limits, and introduce changes to payment processing. Even a 5–10% increase in the Decline Rate over a few hours can indicate an underlying technical issue.
Teams that focus solely on the number of first-time deposits often detect these problems too late. Monitoring Success Rate and Decline Rate allows affiliates to identify issues much earlier and adjust their campaigns before performance is significantly affected.
Why It’s Harder to Kill Underperforming Campaigns in July
During the summer, finding a new winning campaign is often easier than knowing when to stop running an existing one. Lower CPCs driven by reduced competition in Facebook’s ad auction can create the illusion that a temporary performance dip will eventually correct itself.
In reality, many affiliates fall into the trap of delayed conversions, attributing weaker results solely to seasonality. More often, the issue lies with the traffic itself rather than the product. During the summer, Tier-1 users respond differently to gambling creatives, while Facebook’s algorithms gradually optimize delivery toward less engaged audiences.
Instead of continuing to scale a declining campaign in the hope that retention will improve later, it’s usually more effective to pause underperforming setups early and reallocate budget to testing new angles and creatives that better match July’s seasonal demand.
Deep Localization: Which GEOs Need It Most?
These seasonal shifts are particularly noticeable in mature Tier-1 markets such as Germany, Austria, and Canada.
Users in these markets have been exposed to gambling advertising for years. They’ve seen countless welcome bonuses, promotional offers, and product concepts, making it much harder for generic campaigns to stand out. Simply increasing a welcome bonus is no longer a meaningful competitive advantage.
At N1 Partners, we take a broader product-driven approach that focuses on:
- deep product localization;
- personalized retention strategies;
- VIP mechanics;
- local payment methods;
- a user experience tailored to the specifics of each market.
Summer also changes how users interact with products. People spend more time away from home, rely more heavily on mobile devices, and switch between content more quickly. At the same time, major sporting events remain a powerful driver of engagement. Products optimized for mobile, fast gameplay, and user journeys that naturally fit summer behaviour tend to deliver the strongest results.
At the same time, lower-cost traffic in Latin America and Asia can be misleading. High registration volumes don’t necessarily translate into strong profitability, especially when optimization focuses on installs or registrations rather than first-time deposits and long-term player value.
Why Brands Are Prioritizing Quality Over Volume
Over the past few months, brands have significantly changed the way they evaluate affiliate traffic. The focus has shifted from traffic volume to user quality and long-term value.
Today, affiliates are increasingly expected to provide transparent source-level reporting, full-funnel analytics, traffic segmentation, and insights into the quality of the acquired audience.
As a result, the best commercial terms are no longer reserved exclusively for the largest affiliates.
According to N1 Partners, the key differentiators today are:
- strong expertise in traffic analytics;
- the ability to quickly identify changes in the registration-to-deposit conversion rate;
- fast campaign optimization and decision-making;
- stable LTV and healthy DepSum/Payout economics;
- transparent communication between affiliates and affiliate managers.
This approach enables long-term partnerships and sustainable growth—even without continuously increasing traffic volumes.
Key Takeaway
Seasonality changes user behaviour, Facebook’s algorithms adjust traffic distribution, and traditional advertising metrics are no longer enough to evaluate campaign performance.
At N1 Partners, we recommend taking a full-funnel approach by looking beyond CTR, CPC, and registration volume. Instead, evaluate user cohorts, Success Rate, Decline Rate, deposit quality, and overall ROI to make more informed optimization decisions.
Work with N1 Partners and Turn Insights into Results
- 14+ casino and sportsbook brands with strong Reg2Dep conversion
- 10+ Tier-1 GEOs
- CPA up to €700 and RevShare up to 55%, plus NNCO for top-performing affiliates
Be number one with N1!

Esportes Gaming Brasil (EGB) says all three of its brands—Esportes da Sorte, Onabet and Lottu—have been shortlisted for the Reclame Aqui Awards 2026, a Brazilian awards programme focused on corporate reputation and customer relationships. The group announced the nominations on Thursday 16th July.
EGB said it is the first time the three brands have been nominated simultaneously. Esportes da Sorte is shortlisted in the Ultra Sports Betting Operators (Mega Operations) category, while Onabet and Lottu are in the Sports Betting Operators (Mega Operations) category.
“Receiving nominations for all three Group brands at the Reclame Aqui Awards for the first time is incredibly meaningful recognition of the work we carry out every day. More than simply an achievement, it reflects our consistent strategy of putting the customer at the centre of every decision by investing in technology, operational efficiency and personalised customer service to build long-term relationships based on trust,” said Maria Neves, Director of Customer Experience, Customer Support and Reputation Channels at Esportes Gaming Brasil.
The company attributed the nominations to ongoing investment in customer service processes, technology integration, employee training and changes to the user journey across its brands. EGB also said it reduced average response time for human customer support from 30 minutes to two minutes.
Reclame Aqui Awards winners are decided by consumer voting, according to the company. Public voting for the 2026 edition is scheduled to run from 2 September to 5 November.
The post Esportes Gaming Brasil lands three brand nominations at Reclame Aqui Awards 2026 appeared first on EE Gaming | Global iGaming & Tech Intelligence Hub.
Deal expands bet365 casino rollout in Spain and Ontario, with 50+ Gaming Corps titles certified for Alberta from 13 July 2026.
Gaming Corps has launched with bet365 in Alberta on the first day of the province’s regulated iGaming market opening (13 July 2026), while also expanding its content footprint with the operator in Spain and Ontario.
The Sweden-based, publicly listed game developer said it is among the first wave of studios certified for Alberta, supporting bet365’s entry with more than 50 games available at launch. The day-one portfolio spans Slots, Table, Plinko, Mine Games and Instant Blitz.
Gaming Corps said the expanded partnership includes its football-themed titles, including Penalty Champion: Goals to Glory, plus the 3 Pigs series (3 Pigs of Olympus, 3 Pigs of Olympus 2: Rise of the DemiHog and 3 Pigs of the Caribbean).
The rollout also brings Gaming Corps’ new Low RTP Blackjack titles to bet365, which the supplier said are designed around 93.57% RTP and approximately 6% operator hold, with side-bet mechanics and flexible branding options.
Graham Greensmith, Chief Commercial Officer at Gaming Corps, said: “Extending our partnership with bet365 across Spain, Ontario and Alberta is a major moment for Gaming Corps, but Alberta is the real statement here. Going live with bet365 from day one reflects the work our teams have put into certification, onboarding and ensuring we can move quickly and confidently with major operator partners.
“As one of the earliest studios ready for Alberta, we’ll be bringing more than 50 titles to the province. That breadth matters, because it gives operators like bet365 a single partner across multiple verticals, with content designed to support acquisition, engagement and retention across different player segments. Spain and Ontario are also important regulated markets for us and expanding with a global operator of this scale highlights how far Gaming Corps has come in a short period of time.”
Richard Graham, Associate VP of Gaming at bet365 at said: “Gaming Corps has become a valuable content partner, combining recognisable game identities with formats that add variety across our casino offering. We are pleased to extend the partnership into Spain, Ontario and Alberta, with the Alberta launch particularly important as part of our day-one commitment to the market.
“Expanding the relationship across multiple territories in a relatively short period reflects the strength of the collaboration, as well as the Gaming Corps team’s clear product direction, commitment and continued development as a game vendor. We look forward to giving players access to a wide-ranging portfolio from the moment the market opens.”
The post Gaming Corps goes live with bet365 in Alberta on regulated market day one appeared first on EE Gaming | Global iGaming & Tech Intelligence Hub.

-

 Compliance Updates5 days ago
Arizona Department of Gaming Issues Cease-and-Desist Orders to Multiple Operators Linked to Underage Gambling and Illegal Activity
-
 Latest News7 days ago
ELA Games releases Flames Fruits Frenzy Hold and Win slot
-
Compliance Updates6 days ago
KONAMI GROUP’s Konami Gaming Inc. First to Submit Manufacturer License Application in Japan’s Emerging IR Market
-
Latest News7 days ago
PG Soft appoints Hugo Baungartner as General Manager LatAm
-
Canada7 days ago
Canada’s Safer Gambling Gap: Why Market Success Doesn’t Always Equal Player Safety
-
Latest News7 days ago
Booming Games launches Fish Tales: Double Catch Max Scatter
-
Latest News7 days ago
Tom Horn Gaming ships Royal Ruby FeatureStorm slot worldwide on 14 July 2026
-
Latest News7 days ago
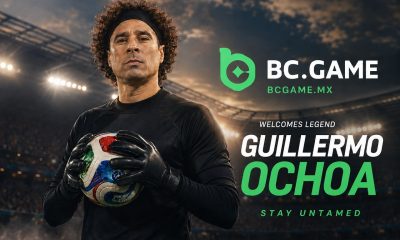
BC.GAME names Guillermo Ochoa brand ambassador for Mexico push