Canada
Gambling.com Group Reports 2021 Financial Results
Gambling.com Group Limited, a leading provider of digital marketing services for the global online gambling industry, today announced its operating and financial results for the year and the fourth quarter ended December 31, 2021.
2021 Financial Highlights
- North American revenue grew 89% to $7.5 million compared to $4.0 million for the prior year
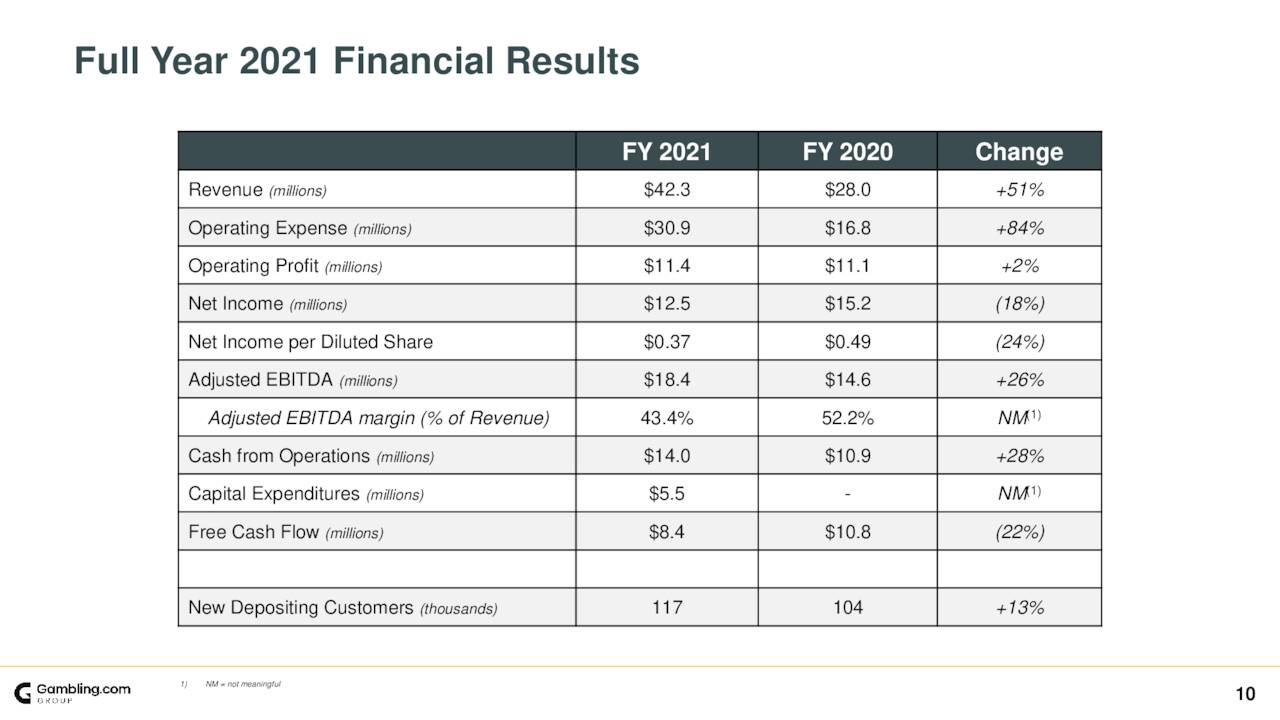
- Revenue of $42.3 million grew 51% compared to $28.0 million for the prior year
- Net income of $12.5 million, or $0.37 per diluted share, compared to a net income of $15.2 million, or $0.49 per diluted share, for the prior year
- Adjusted EBITDA of $18.4 million increased 26% compared to $14.6 million for the prior year, representing an Adjusted EBITDA margin of 43%1
- Free cash flow of $8.4 million decreased 22% compared to $10.8 million for the prior year1
Fourth Quarter 2021 Financial Highlights
- North American revenue grew 56% to $2.2 million compared to $1.4 million in the same period for the prior year
- Revenue of $10.3 million remained consistent to $10.3 million in the same period for the prior year
- Net income of $0.9 million, or $0.02 per diluted share, compared to a net income of $8.5 million, or $0.35 per diluted share, in the same period for the prior year
- Adjusted EBITDA of $2.3 million decreased 63% compared to $6.1 million in the same period for the prior year, representing an Adjusted EBITDA margin of 22%1
- Free cash flow of $(1.8 million) compared to $3.5 million for the prior year1
Business Highlights
- Completed successful public listing of ordinary shares on the Nasdaq Global Market in July 2021 under the ticker symbol “GAMB”
- Named the 2021 EGR Affiliate of the Year and 2021 SBC North America Casino Affiliate of the Year
- Delivered 117,000 new depositing customers in 2021 compared to 104,000 in 2020
- Launched several new U.S.- facing websites during 2021 and acquired an incredibly strong portfolio of U.S. specific domain names
- Announced the acquisition of RotoWire.com – a leader in U.S online fantasy sports – in December 2021 to leverage RotoWire’s high-quality traffic and drive substantial incremental sports betting affiliate revenue in the U.S., the acquisition was completed on January 1, 2022
- Announced media partnership with McClatchy in January 2022 to monetize the McClatchy portfolio of digital media assets through sports betting in 29 markets across 14 states
- Successfully entered the New York and Louisiana markets in January 2022
- Announced acquisition of BonusFinder.com in February 2022 to better position the Group for the upcoming market launch in Ontario and further strengthening the Group’s North American presence
“We grew our revenue in 2021 by 51% compared to the prior year, delivered an EBITDA margin of 43% and generated over $8 million of free cash flow as many other industry players struggled to find a path to sustainable profitability,” said Charles Gillespie, Chief Executive Officer and Co-founder of Gambling.com Group. “As we look towards 2022, we are encouraged by the strongest start to a year we have seen in our 15-year history. Helped by launches in New York and Louisiana, January was our best-single month performance ever – even before consolidating financial results from our recent acquisitions. Just in January, we have seen the total addressable market in North America expand by leaps and bounds and there is a clear path to additional state launches this year, along with the impending launch of Ontario next month. As B2C operators in the U.S. seek a path to sustainable profitability and evaluate their marketing spend going forward, we believe that the affiliate model is ideally positioned to provide operators with more effective, higher ROI investments where they can clearly attribute the source, profitability and lifetime value of a referred player. We view this shift as greatly benefitting the value of our performance marketing revenue model, and we are confident that these tailwinds support what we expect to be another year of record performance for the Group.”
2022 Outlook
Based on currently available information, the Group estimates that, for the full year 2022:
- Total revenue will be in the range of $71 million and $76 million; and
- Adjusted EBITDA will be in the range $22 million and $27 million1
Elias Mark, Chief Financial Officer of Gambling.com Group, added, “Our expectation for another year of record revenue and Adjusted EBITDA is supported primarily by our premier domain portfolio and our growing presence in the U.S. achieved through continuous investments in U.S-facing assets. Organic growth in North America is complemented by our recent acquisitions of RotoWire.com and BonusFinder.com as well as our initiatives to further our leadership in the more established markets that we currently serve. As we have stated, our Adjusted EBITDA margin may deviate from target in the short-term as we strategically invest to strengthen our U.S. footprint, which is reflected in our 2022 outlook. Nonetheless, our profitability metrics remain among the very best in the industry, and our free cash flow generation more than covers our organic growth initiatives and the acquisition of domain names and other assets. We entered 2022 on strong financial footing and are off to the best start to a year in the Company history led by strong growth in North America. We grew total revenue profitably by 51% in 2021 and we look forward to accelerate that rate of profitable growth in 2022.”
|
2021 – 2023 Financial Targets |
||
|
|
|
|
|
Total Revenue Growth |
|
> Average 40% |
|
Adjusted EBITDA Margin1 |
|
> Average 40% |
|
Leverage2 |
|
< Net Debt to Adjusted EBITDA 2.5x3 |
1 Adjusted figures represent non-IFRS information. See “Non-IFRS Financial Measures” and the tables at the end of this release for an explanation of the adjustments and reconciliations to the comparable IFRS numbers.
2 Leverage is defined as Net Debt as a proportion of Adjusted EBITDA.
3 Net Debt is defined as Borrowings less Cash and Cash Equivalents.
|
2021 vs. 2020 Financial Highlights |
||||||||||||||||
|
|
|
YEAR ENDED |
|
|
CHANGE |
|
||||||||||
|
|
|
2021 |
|
|
2020 |
|
|
$ |
|
|
% |
|
||||
|
|
|
(in thousands USD, except for |
|
|
|
|
|
|
|
|||||||
|
CONSOLIDATED STATEMENTS OF |
|
|||||||||||||||
|
Revenue |
|
|
42,323 |
|
|
|
27,980 |
|
|
|
14,343 |
|
|
|
51 |
% |
|
Operating expenses |
|
|
(30,931 |
) |
|
|
(16,849 |
) |
|
|
(14,082 |
) |
|
|
84 |
% |
|
Operating profit |
|
|
11,392 |
|
|
|
11,131 |
|
|
|
261 |
|
|
|
2 |
% |
|
Income before tax |
|
|
12,164 |
|
|
|
10,752 |
|
|
|
1,412 |
|
|
|
13 |
% |
|
Net income for the period attributable to the |
|
|
12,453 |
|
|
|
15,151 |
|
|
|
(2,698 |
) |
|
|
(18 |
)% |
|
Net income per share attributable to ordinary |
|
|
0.40 |
|
|
|
0.55 |
|
|
|
(0.15 |
) |
|
|
(27 |
)% |
|
Net income per share attributable to ordinary |
|
|
0.37 |
|
|
|
0.49 |
|
|
|
(0.12 |
) |
|
|
(24 |
)% |
|
|
|
YEAR ENDED |
|
|
CHANGE |
|
||||||||||
|
|
|
2021 |
|
|
2020 |
|
|
$ |
|
|
% |
|
||||
|
|
|
(in thousands USD, except Adjusted EBITDA Margin, unaudited) |
|
|
|
|
|
|
|
|||||||
|
NON-IFRS FINANCIAL MEASURES |
|
|
|
|
|
|
|
|
|
|
|
|
||||
|
Adjusted EBITDA |
|
|
18,356 |
|
|
|
14,608 |
|
|
|
3,748 |
|
|
|
26 |
% |
|
Adjusted EBITDA Margin |
|
|
43 |
% |
|
|
52 |
% |
|
n/m |
|
|
n/m |
|
||
|
Free Cash Flow |
|
|
8,423 |
|
|
|
10,804 |
|
|
|
(2,381 |
) |
|
|
(22 |
)% |
n/m = not meaningful
|
|
|
YEAR ENDED |
|
|
CHANGE |
|
||||||||||
|
|
|
2021 |
|
|
2020 |
|
|
Amount |
|
|
% |
|
||||
|
|
|
(in thousands, unaudited) |
|
|
|
|
|
|
|
|||||||
|
OTHER SUPPLEMENTAL DATA |
|
|
|
|
|
|
|
|
|
|
|
|
||||
|
New Depositing Customers (1) |
|
|
117 |
|
|
|
104 |
|
|
|
13 |
|
|
|
13 |
% |
- We define New Depositing Customers, or NDCs, as unique referral of a player from our system to one of our customers that satisfied an agreed metric (typically making a deposit above a minimum threshold) with the customer, thereby triggering the right to a commission for us.
Revenue
Total revenue increased 51% to $42.3 million for the year ended December 31, 2021 compared to $28.0 million for the prior year. On a constant currency basis, revenue increased $13.4 million, or 46%. Revenue growth was organic. The increase was driven by both growth in NDCs and improved monetization of NDCs that we attribute to a combination of technology improvements and changes in product and market mix. NDCs increased 13% to 117,000 compared to 104,000 in the prior year.
Our revenue disaggregated by market is as follows:
|
|
|
YEAR ENDED |
|
|
CHANGE |
|
||||||||||
|
|
|
2021 |
|
|
2020 |
|
|
$ |
|
|
% |
|
||||
|
|
|
(in thousands USD) |
|
|
|
|
|
|
|
|||||||
|
U.K. and Ireland |
|
|
21,391 |
|
|
|
16,189 |
|
|
|
5,202 |
|
|
|
32 |
% |
|
Other Europe |
|
|
10,800 |
|
|
|
5,252 |
|
|
|
5,548 |
|
|
|
106 |
% |
|
North America |
|
|
7,484 |
|
|
|
3,959 |
|
|
|
3,525 |
|
|
|
89 |
% |
|
Rest of the world |
|
|
2,648 |
|
|
|
2,580 |
|
|
|
68 |
|
|
|
3 |
% |
|
Total revenues |
|
|
42,323 |
|
|
|
27,980 |
|
|
|
14,343 |
|
|
|
51 |
% |
Revenue increases were primarily driven by growth in revenue from the U.K. and Ireland, Other Europe, and North America.
Our revenue disaggregated by monetization is as follows:
|
|
|
YEAR ENDED |
|
|
CHANGE |
|
||||||||||
|
|
|
2021 |
|
|
2020 |
|
|
$ |
|
|
% |
|
||||
|
|
|
(in thousands USD) |
|
|
|
|
|
|
|
|||||||
|
Hybrid commission |
|
|
15,616 |
|
|
|
14,738 |
|
|
|
878 |
|
|
|
6 |
% |
|
Revenue share commission |
|
|
3,596 |
|
|
|
3,308 |
|
|
|
288 |
|
|
|
9 |
% |
|
CPA commission |
|
|
18,591 |
|
|
|
9,047 |
|
|
|
9,544 |
|
|
|
105 |
% |
|
Other revenue |
|
|
4,520 |
|
|
|
887 |
|
|
|
3,633 |
|
|
|
410 |
% |
|
Total revenues |
|
|
42,323 |
|
|
|
27,980 |
|
|
|
14,343 |
|
|
|
51 |
% |
Revenue increases were driven primarily by additional Cost Per Acquisition, or CPA, commission and Other revenue. The increase in Other revenue was driven by bonuses related to achieving certain operator NDC performance targets and fixed fees.
Our revenue disaggregated by product type from which it is derived is as follows:
|
|
|
YEAR ENDED |
|
|
CHANGE |
|
||||||||||
|
|
|
2021 |
|
|
2020 |
|
|
$ |
|
|
% |
|
||||
|
|
|
(in thousands USD) |
|
|
|
|
|
|
|
|||||||
|
Casino |
|
|
35,632 |
|
|
|
24,135 |
|
|
|
11,497 |
|
|
|
48 |
% |
|
Sports |
|
|
6,188 |
|
|
|
3,210 |
|
|
|
2,978 |
|
|
|
93 |
% |
|
Other |
|
|
503 |
|
|
|
635 |
|
|
|
(132 |
) |
|
|
(21 |
)% |
|
Total revenues |
|
|
42,323 |
|
|
|
27,980 |
|
|
|
14,343 |
|
|
|
51 |
% |
Revenue increases were driven by growth in revenue from casino and sports products.
Operating Expenses
|
|
|
YEAR ENDED |
|
|
CHANGE |
|
||||||||||
|
|
|
2021 |
|
|
2020 |
|
|
$ |
|
|
% |
|
||||
|
|
|
(in thousands USD) |
|
|
|
|
|
|
|
|||||||
|
Sales and marketing expenses |
|
|
14,067 |
|
|
|
8,103 |
|
|
|
5,964 |
|
|
|
74 |
% |
|
Technology expenses |
|
|
3,947 |
|
|
|
2,503 |
|
|
|
1,444 |
|
|
|
58 |
% |
|
General and administrative expenses |
|
|
13,014 |
|
|
|
5,956 |
|
|
|
7,058 |
|
|
|
119 |
% |
|
Movements in credit losses allowance and write offs |
|
|
(97 |
) |
|
|
287 |
|
|
|
(384 |
) |
|
|
(134 |
)% |
|
Total operating expenses |
|
|
30,931 |
|
|
|
16,849 |
|
|
|
14,082 |
|
|
|
84 |
% |
Total operating expenses increased by $14.1 million to $30.9 million compared to $16.8 million in the prior year. On a constant currency basis, operating expenses increased by $13.5 million, or 77%. The increase was driven primarily by increased headcount across Sales and Marketing, Technology, and General and Administrative functions as we invest in the Company’s organic growth initiatives as well as increased administrative expenses associated with operating as a public company.
Sales and Marketing expenses totaled $14.1 million compared to $8.1 million in the prior year. The increase was driven primarily by increased wages and salary expenses associated with increased headcount.
Technology expenses totaled $4.0 million compared to $2.5 million in the prior year. The increase was driven primarily by increased wages and salary expenses associated with increased headcount partially offset by capitalized development costs.
General and Administrative expenses totaled $13.0 million compared to $6.0 million in the prior year. The increase was driven primarily by increased wages and salary expenses associated with increased headcount, professional services, and insurance expenses.
Earnings
Adjusted EBITDA increased by 26% to $18.4 million compared to $14.6 million in the prior year representing an Adjusted EBITDA margin of 43%. The increase was driven primarily by increased revenue partly offset by increased operating expenses.
Operating profit remained relatively constant at $11.4 million compared to $11.1 million in 2020. Operating profit in 2021 was affected by non-recurring costs related to the public offering and future acquisitions by $2.6 million, and share based payments costs by $ 2.0 million ($0.7 million and $0.4 million, respectively, in 2020).
Net income totaled $12.5 million, or $0.37 per diluted share, compared to net income of $15.2 million, or $0.49 per diluted share, in the prior year. Net income in 2020 was positively affected by the recognition of deferred tax assets of $5.4 million and gain from bonds’ redemption of $1.4 million ($1.8 million and zero, respectively, in 2021).
Free Cash-flow
Total cash generated from operations of $14.0 million increased 28% compared to $10.9 million in the prior year. The increase was driven primarily by increased adjusted EBITDA. Free cash flow totaled $8.4 million compared to $10.8 million in the prior year. The decline was the result of increased cash flow generated from operations offset by increased capital expenditures consisting primarily of the acquisition of domain names and capitalized development costs.
|
Balance Sheet |
||||||||||||||||
|
|
|
AS OF |
|
|
CHANGE |
|
||||||||||
|
|
|
2021 |
|
|
2020 |
|
|
$ |
|
|
% |
|
||||
|
|
|
|
|
|
|
|
|
|
|
|
|
|
||||
|
|
|
(in thousands, USD) |
|
|
|
|
|
|
|
|||||||
|
CONSOLIDATED STATEMENTS OF FINANCIAL |
|
|
|
|
|
|
|
|
|
|
|
|
||||
|
Cash and cash equivalents |
|
|
51,047 |
|
|
|
8,225 |
|
|
|
42,822 |
|
|
|
521 |
% |
|
Working capital (2) |
|
|
46,714 |
|
|
|
10,059 |
|
|
|
36,655 |
|
|
|
364 |
% |
|
Total assets |
|
|
91,025 |
|
|
|
45,383 |
|
|
|
45,642 |
|
|
|
101 |
% |
|
Total borrowings |
|
|
5,944 |
|
|
|
5,960 |
|
|
|
(16 |
) |
|
|
(0 |
)% |
|
Total liabilities |
|
|
11,116 |
|
|
|
11,171 |
|
|
|
(55 |
) |
|
|
(0 |
)% |
|
Total equity |
|
|
79,909 |
|
|
|
34,212 |
|
|
|
45,697 |
|
|
|
134 |
% |
- Working capital is defined as total current assets minus total current liabilities.
n/m = not meaningful
Cash balances as of December 31, 2021 totaled $51.0 million, an increase of $42.8 million compared to $8.2 million as of December 31, 2020. Working capital as of December 31, 2021 totaled $46.7 million, an increase of $36.6 million compared to $10.1 million as of December 31, 2020.
Total assets as of December 31, 2021 were $91.0 million compared to $45.4 million as of December 31, 2020. Total borrowings, including accrued interest, remained constant at $5.9 million as of December 31, 2021 and 2020. Total liabilities decreased slightly as of December 31, 2021 to $11.1 million compared to $11.2 million as of December 31, 2020.
Total equity as of December 31, 2021 was $79.9 million compared to $34.2 million as of December 31, 2020.
The increases in working capital, total assets, and total equity were driven primarily by the net proceeds received from the IPO and operating profit and net income generated by the Company.
|
Fourth Quarter 2021 vs. Fourth Quarter 2020 Financial Highlights |
||||||||||||||||
|
|
|
THREE MONTHS ENDED |
|
|
CHANGE |
|
||||||||||
|
|
|
2021 |
|
|
2020 |
|
|
$ |
|
|
% |
|
||||
|
|
|
(in thousands USD, except for |
|
|
|
|
|
|
|
|||||||
|
CONSOLIDATED STATEMENTS OF |
|
|||||||||||||||
|
Revenue |
|
|
10,291 |
|
|
|
10,267 |
|
|
|
24 |
|
|
|
0 |
% |
|
Operating expenses |
|
|
(9,668 |
) |
|
|
(5,897 |
) |
|
|
(3,771 |
) |
|
|
64 |
% |
|
Operating profit |
|
|
623 |
|
|
|
4,370 |
|
|
|
(3,747 |
) |
|
|
(86 |
)% |
|
Income before tax |
|
|
1,311 |
|
|
|
3,489 |
|
|
|
(2,178 |
) |
|
|
(62 |
)% |
|
Net income for the period attributable to the |
|
|
867 |
|
|
|
8,541 |
|
|
|
(7,674 |
) |
|
|
(90 |
)% |
|
Net income per share attributable to ordinary |
|
|
0.03 |
|
|
|
0.39 |
|
|
|
(0.36 |
) |
|
|
(92 |
)% |
|
Net income per share attributable to ordinary |
|
|
0.02 |
|
|
|
0.35 |
|
|
|
(0.33 |
) |
|
|
(94 |
)% |
|
|
|
THREE MONTHS ENDED |
|
|
CHANGE |
|
||||||||||
|
|
|
2021 |
|
|
2020 |
|
|
$ |
|
|
% |
|
||||
|
|
|
(in thousands USD, |
|
|
|
|
|
|
|
|||||||
|
NON-IFRS FINANCIAL MEASURES |
|
|
|
|
|
|
|
|
|
|
|
|
||||
|
Adjusted EBITDA |
|
|
2,272 |
|
|
|
6,115 |
|
|
|
(3,843 |
) |
|
|
(63 |
)% |
|
Adjusted EBITDA Margin |
|
|
22 |
% |
|
|
60 |
% |
|
n/m |
|
|
|
(38 |
)% |
|
|
Free Cash Flow |
|
|
(1,811 |
) |
|
|
3,533 |
|
|
|
(5,344 |
) |
|
|
(151 |
)% |
n/m = not meaningful
|
|
|
THREE MONTHS ENDED |
|
|
CHANGE |
|
||||||||||
|
|
|
2021 |
|
|
2020 |
|
|
Amount |
|
|
% |
|
||||
|
|
|
(in thousands, unaudited) |
|
|
|
|
|
|
|
|||||||
|
OTHER SUPPLEMENTAL DATA |
|
|
|
|
|
|
|
|
|
|
|
|
||||
|
New Depositing Customers (1) |
|
|
28 |
|
|
|
35 |
|
|
|
(7 |
) |
|
|
(20 |
)% |
- We define New Depositing Customers, or NDCs, as unique referral of a player from our system to one of our customers that satisfied an agreed metric (typically making a deposit above a minimum threshold) with the customer, thereby triggering the right to a commission for us.
Revenue
Total revenue in the fourth quarter remained relatively constant at $10.3 million. On a constant currency basis, revenue remained relatively constant. NDCs decreased 20% to 28,000 compared to 35,000 in the prior year. We attribute the improved monetization of NDCs to a combination of technology improvements and changes in product and market mix.
Our revenue disaggregated by market is as follows:
|
|
|
THREE MONTHS ENDED |
|
|
CHANGE |
|
||||||||||
|
|
|
2021 |
|
|
2020 |
|
|
$ |
|
|
% |
|
||||
|
|
|
(in thousands USD, unaudited) |
|
|
|
|
|
|
|
|||||||
|
U.K. and Ireland |
|
|
5,226 |
|
|
|
5,780 |
|
|
|
(554 |
) |
|
|
(10 |
)% |
|
Other Europe |
|
|
2,260 |
|
|
|
2,299 |
|
|
|
(39 |
) |
|
|
(2 |
)% |
|
North America |
|
|
2,154 |
|
|
|
1,383 |
|
|
|
771 |
|
|
|
56 |
% |
|
Rest of the world |
|
|
651 |
|
|
|
805 |
|
|
|
(154 |
) |
|
|
(19 |
)% |
|
Total revenues |
|
|
10,291 |
|
|
|
10,267 |
|
|
|
24 |
|
|
|
0 |
% |
Changes in revenue were driven by strong organic growth in our North American markets, offset by a decline in the U.K. and Ireland and, to a lesser extent, Other Europe and Rest of the world. U.K. and Ireland revenue was negatively affected by higher than usual volatility in organic search traffic. In the comparable period, U.K. and Ireland revenue was positively affected by increased demand coinciding with restrictive Covid-19 measures. Other Europe was negatively affected by regulatory changes in Germany implemented in July 2021 partly offset by growth in revenue from other European markets.
Our revenue disaggregated by monetization is as follows:
|
|
|
THREE MONTHS ENDED |
|
|
CHANGE |
|
||||||||||
|
|
|
2021 |
|
|
2020 |
|
|
$ |
|
|
% |
|
||||
|
|
|
(in thousands USD, unaudited) |
|
|
|
|
|
|
|
|||||||
|
Hybrid commission |
|
|
2,935 |
|
|
|
5,557 |
|
|
|
(2,622 |
) |
|
|
(47 |
)% |
|
Revenue share commission |
|
|
744 |
|
|
|
1,004 |
|
|
|
(260 |
) |
|
|
(26 |
)% |
|
CPA commission |
|
|
5,202 |
|
|
|
3,271 |
|
|
|
1,931 |
|
|
|
59 |
% |
|
Other revenue |
|
|
1,410 |
|
|
|
435 |
|
|
|
975 |
|
|
|
224 |
% |
|
Total revenues |
|
|
10,291 |
|
|
|
10,267 |
|
|
|
24 |
|
|
|
0 |
% |
Revenue from CPA commission and Other revenue increased whereas revenue from hybrid and revenue share commission decreased. The changes in monetization were primarily a result of changes in market mix with a higher proportion of revenue from the U.S compared to the previous year. The increase in Other revenue was driven primarily by bonuses related to achieving certain operator NDC performance targets and fixed fees.
Our revenue disaggregated by product type from which it is derived is as follows:
|
|
|
THREE MONTHS ENDED |
|
|
CHANGE |
|
||||||||||
|
|
|
2021 |
|
|
2020 |
|
|
$ |
|
|
% |
|
||||
|
|
|
(in thousands USD, unaudited) |
|
|
|
|
|
|
|
|||||||
|
Casino |
|
|
8,466 |
|
|
|
8,846 |
|
|
|
(380 |
) |
|
|
(4 |
)% |
|
Sports |
|
|
1,769 |
|
|
|
1,160 |
|
|
|
609 |
|
|
|
53 |
% |
|
Other |
|
|
56 |
|
|
|
261 |
|
|
|
(205 |
) |
|
|
(79 |
)% |
|
Total revenues |
|
|
10,291 |
|
|
|
10,267 |
|
|
|
24 |
|
|
|
0 |
% |
Revenue increases were driven by growth in revenue from sports products offset by a decrease in casino and other revenue.
Operating Expenses
|
|
|
THREE MONTHS ENDED |
|
|
CHANGE |
|
||||||||||
|
|
|
2021 |
|
|
2020 |
|
|
$ |
|
|
% |
|
||||
|
|
|
(in thousands USD, unaudited) |
|
|
|
|
|
|
|
|||||||
|
Sales and marketing expenses |
|
|
4,632 |
|
|
|
2,442 |
|
|
|
2,190 |
|
|
|
90 |
% |
|
Technology expenses |
|
|
1,190 |
|
|
|
798 |
|
|
|
392 |
|
|
|
49 |
% |
|
General and administrative expenses |
|
|
3,877 |
|
|
|
2,609 |
|
|
|
1,268 |
|
|
|
49 |
% |
|
Movements in credit losses allowance and write offs |
|
|
(31 |
) |
|
|
48 |
|
|
|
(79 |
) |
|
|
(165 |
)% |
|
Total operating expenses |
|
|
9,668 |
|
|
|
5,897 |
|
|
|
3,771 |
|
|
|
64 |
% |
Total operating expenses increased by $3.8 million to $9.7 million compared to $5.9 million in the prior year. On a constant currency basis, operating expenses increased by $3.6 million, or 58%. The increase was driven primarily by headcount across Sales and Marketing, Technology, and General and Administrative functions as we invest in the Company’s organic growth initiatives as well as increased administrative expenses associated with operating as a public company.
Sales and Marketing expenses totaled $4.6 million compared to $2.4 million in the prior year. The increase was driven primarily by increased wages and salary expenses associated with increased headcount.
Technology expenses totaled $1.2 million compared to $0.8 million in the prior year. The increase was driven primarily by increased wages and salary expenses associated with increased headcount partially offset by capitalized development costs.
General and Administrative expenses totaled $3.9 million compared to $2.6 million in the prior year. The increase was driven primarily by increased wages and salary expenses associated with increased headcount, professional services, and insurance expenses.
Earnings
Adjusted EBITDA decreased by 63% to $2.3 million compared to $6.1 million in the prior year representing an Adjusted EBITDA margin of 22%. The decrease was driven by increased operating expenses.
Operating profit in the fourth quarter decreased 86% to $0.6 million compared to $4.4 million in 2020. The decrease was driven primarily by a decrease in Adjusted EBITDA and an increase in share-based payments expense.
Net income in the fourth quarter totaled $0.9 million, or $0.02 per diluted share, compared to net income of $8.5 million, or $0.35 per diluted share, in the prior year. Net income in the forth quarter 2021 was positively affected by a USD/Euro foreign currency exchange gain of $1.1 million (zero in 2020). While net income in the fourth quarter of 2020 was positively affected by the recognition of deferred tax assets of $5.4 million (deferred tax asset reduction of $0.2 million in 2021).
Powered by WPeMatico

Canada
Rivalry Corp. Announces Significant Reduction in Operations and Evaluation of Strategic Alternatives

Rivalry Corp. announced that its Board of Directors has approved a significant reduction in operating activity as the Company evaluates strategic alternatives in respect of its assets and operations.
The Company is engaged in discussions with third parties regarding potential transactions. However, in light of recent performance volatility, the Board has determined to materially reduce the scale of operations while assessing whether a strategic transaction or other alternative can be advanced.
Effective immediately, the Company is implementing substantial cost reductions, including a significant workforce reduction and reduced operating expenditures. The Company has paused player activity on its platform and is facilitating player withdrawals in the ordinary course.
The Company is assessing a range of potential alternatives, which may include asset-level transactions, corporate transactions, restructuring initiatives or other strategic outcomes.
Given the Company’s reduced operating scale and the ongoing evaluation process, there can be no assurance that any strategic alternative will be completed or that operations will continue in their current form.
The post Rivalry Corp. Announces Significant Reduction in Operations and Evaluation of Strategic Alternatives appeared first on Americas iGaming & Sports Betting News.

Evoplay is celebrating another milestone in its regulated-market journey with a new launch in Ontario, teaming up with BetMGM to bring its games to one of Canada’s most dynamic and competitive jurisdictions.
The rollout introduces 18 Evoplay titles to BetMGM Casino in Ontario, carefully selected to deliver long-term engagement and appeal to a wide range of player preferences. The first wave includes proven performers such as:
• Hot Triple Sevens
• Hot Volcano
• Gold of Sirens Bonus Buy
• Inner Fire Bonus Buy.
These are games that have already demonstrated strong results across multiple regulated markets.
This launch marks another confident step in Evoplay’s Canadian expansion, reinforcing the company’s commitment to aligning its content with local market requirements, player expectations, and regulatory standards.
Alex Malchenko, Head of Sales at Evoplay, said: Ontario continues to set a high standard for regulated online casinos, making it a market where the right partnerships truly matter. Collaborating with BetMGM allows us to expand our reach with a portfolio that has already performed strongly across multiple areas and territories.
Oliver Bartlett, VP of Gaming at BetMGM, said: “Partnering with Evoplay adds a strong selection of proven, high-performing titles to our growing portfolio in Ontario.”
The post Evoplay Strengthens Canadian Presence with BetMGM Partnership appeared first on Americas iGaming & Sports Betting News.

Spintec is expanding its footprint in North America by partnering with Bet Rite in the Canadian gambling sector. As a prominent developer of electronic table games, Spintec invested significant effort into locating a partner who comprehends the distinctiveness of the Canadian casino industry. Bet Rite is taking on the position of Spintec’s distributor in Canada, leveraging its established reputation and substantial industry knowledge. This collaboration combines global innovation with local expertise in a partnership that is helping Spintec advance its expansion objectives in North America.
Bet Rite’s establishment is rooted in years of industry expertise. The firm focuses on providing top-notch gaming solutions designed specifically for Canadian operators. They aim to provide a sole vendor connection that grants access to numerous top-tier product lines, establishing them as a reliable partner nationwide.
For Spintec, collaborating with a company that prioritizes service, product excellence, and enduring relationships is vital, and Bet Rite is dedicated to prioritizing customer needs. With a solid sales network and a reputation for dependability, their market stance is highly strong.
Through this collaboration, Spintec is guaranteeing that their creative products receive backing from an attentive, community-focused service. The initial product line to be launched in the Canadian market will be Spintec’s premier Charisma line. Charisma’s design, flexibility, innovation, and wide range of product customizations will undoubtedly make it a top seller in Canada as well.
Billy Maclellan, Bet Rite President, says: “Our company has grown by offering best-in-class suppliers the local support that they need. Spintec fits the mold perfectly and together we are well placed to make this partnership a glowing success”
Goran Sovilj, Spintec’s Chief Commercial Officer, agrees: “Bet Rite’s deep understanding of the Canadian market makes this alliance very promising. We are always excited to introduce innovative and exciting products to new markets, especially when our distributors are as experienced and knowledgeable as Bet Rite.”
The post Spintec Expands into Canada with Bet Rite appeared first on Eastern European Gaming | Global iGaming & Tech Intelligence Hub.

-

 Amusnet5 days ago
Week 7/2026 slot games releases
-
Aphrodite’s Kiss5 days ago
Love on the Reels: Slotland Introduces “Aphrodite’s Kiss”
-
Denmark6 days ago
RoyalCasino Partners with ScatterKings for Company’s Danish Launch
-
Finnish Institute for Health and Welfare7 days ago
Finland’s Health Authority Launches “2-4-2” Gambling Risk Limits Ahead of Expected Advertising Boom
-
Latest News7 days ago
WinSpirit’s UnValentine’s Day: A New Take on February Engagement
-
Bryndís Hrafnkelsdóttir7 days ago
NOVOVISION Implemented at the University of Iceland Lottery
-
40 Treasures7 days ago
CT Interactive Enters into Partnership with Mozzartbet.rs
-
Booming Games6 days ago
Treasure Hunt Revival — Booming Games Launches Gold Gold Gold Hold and Win