Latest News
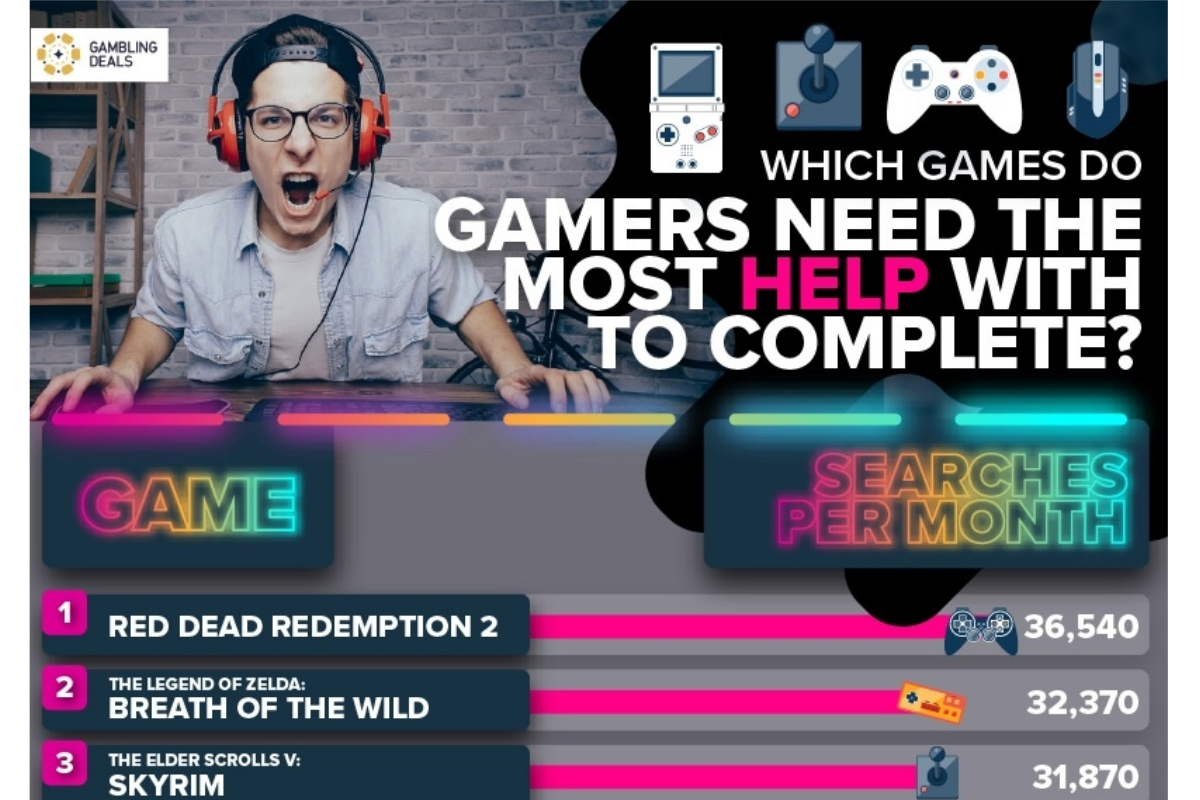
Which Games Do Players Need the Most Help with to Complete?
-
Red Dead Redemption 2 receives 36,540 monthly searches from gamers looking for tips and tricks in order to complete it
-
In second place is The Legend of Zelda: Breath of the Wild; 32,370 searches are made each month from people searching for shortcuts
-
Gamers in the USA find the original Halo the hardest to complete, with 19,750 people making searches each month
-
Gamers in Canada need the most assistance with Grand Theft Auto V (4,570 monthly searches)
Many games hold well-deserved reputations for being difficult, but which ones do players need the most assistance with?
Gamblingdeals.com sought to find out by scouring the internet to discover which games are the hardest and most time consuming to complete. Using SEMrush they analysed search volumes for terms such as ‘[game] final boss’ and ‘[game] solution’ to uncover which one gamers find the hardest to complete. *
Which Games Are Hardest to Complete?
After analysing data from Germany, Canada, France, USA and UK, Gamblingdeals.com can reveal that Red Dead Redemption 2 is the game that players need the most assistance with.
It receives 36,540 online searches each month from gamers trying to discover how to complete, beat and understand the ending. On average, completionists of this game spend 164 hours trying to finish the main story and extras!
In second place is The Legend of Zelda: Breath of the Wild! Each month there are 32,370 searches from gamers trying to figure out how to complete the game and beat Calamity Ganon, the final boss.
Breath of the Wild takes an estimated 186 hours to finish, and although it was released in 2017, it appears that many are still struggling to reach the end.
Ranking as the third hardest game to complete is The Elder Scrolls V: Skyrim, receiving 31,870 searches per month from gamers who wish to reach the end and bring Alduin to his demise. In total, taking an estimated 229 hours to complete the game, so there’s no surprise it ranks highly!
Following in fourth, fifth and sixth are Halo (26,300 monthly searches), Grand Theft Auto V (20,630 monthly searches) and Dark Souls III (19,850 monthly searches).
To complete the top 10, other games which players need help with include:
7. Grand Theft Auto: San Andreas receives 18,430 monthly searches and takes 84 hours to fully complete.
8. Grand Theft Auto IV receives 10,200 monthly searches and takes 77.5 hours to fully complete.
9. The Legend of Zelda receives 9,360 monthly searches and takes 10.5 hours to fully complete.
10. Grand Theft Auto: Vice City receives 7,410 monthly searches and takes 91.5 hours to fully complete (including Vice City Stories).
Which Games Are Hardest for Each Country?
Gamblingdeals.com analysed monthly search volume data across North America and Europe countries to discover which countries from these countries generate the most gaming revenue and can reveal the games they find hardest to complete!
USA ($36,921M): Halo (19,750 searches), Red Dead Redemption 2 (13,170 searches) and The Elder Scrolls V: Skyrim (11,630 searches).
Germany ($5,965M): The Legend of Zelda: Breath of the Wild (11,070 searches), Red Dead Redemption 2 (8,480 searches) and The Elder Scrolls V: Skyrim (7,250 searches).
UK ($5,511M): Red Dead Redemption 2 (5,450 searches), Grand Theft Auto V (4,520 searches) and The Elder Scrolls V: Skyrim (3,650 searches).
France ($3,987M): The Legend of Zelda: Breath of the Wild (10,100 searches), Red Dead Redemption 2 (5,550 searches), The Elder Scrolls V: Skyrim (5,400 searches).
Canada ($3,051M): Grand Theft Auto V (4,570 searches), The Elder Scrolls V: Skyrim (3,940 searches), and Red Dead Redemption 2 (3,890 searches).
*Methodology:
-
GamblingDeals.com analysed 41 different games which have been compiled from previous articles that state they are among the ‘hardest’ or take the ‘longest’ to complete.
-
Using search analytics tool SEMrush, they looked at the number of searches made from gamers looking for shortcuts or tips on how to complete the game. To do this they looked at the search volumes for each game alongside different words. The words they included are as follows: final boss, complete, ending, beat, final mission, final level, and solution*. For example, one search analysed includes ‘Skyrim final boss’.
-
When analysing search volumes for non-English speaking countries, the English and translated word were both analysed. For example, the search volumes for ‘Red Dead Redemption lösung’ and ‘Red Dead Redemption solution’ were added together to get the final number for Germany.
-
They looked at the number of searches made from the UK, USA, Germany, Canada and France as these are the top five North American and European countries that generate the highest gaming revenue, according to https://newzoo.com/insights/rankings/top-10-countries-by-game-revenues/.
-
GamblingDeals used https://howlongtobeat.com to find out how long each game takes for full completion.
Powered by WPeMatico

Brazil’s regulated betting market continues to gain structure and momentum, as the country balances regulatory consolidation, integrity safeguards, and commercial growth.
Over the past week, key developments, from federal policy implementation to strategic partnerships and product innovation, highlight how the ecosystem is maturing ahead of major global sporting events.
Government launches national policy to combat match-fixing
A major regulatory milestone was reached with the creation of the National Policy for the Prevention and Combating of Sports Manipulation (PNPEMR). Established through a joint ordinance by the Ministries of Sports, Finance, and Justice, the policy introduces a comprehensive national framework designed to address integrity risks in sports.
The initiative is structured around four central pillars: regulation, prevention, monitoring and enforcement, aiming to protect the credibility and unpredictability of sporting competitions in Brazil.
The policy emphasizes interinstitutional cooperation, bringing together public authorities, sports organizations, betting operators and international bodies.
Among its key measures are:
- Standardization of reporting flows for suspicious betting activity
- Continuous education programs for athletes, referees and sports officials
- Protection mechanisms for whistleblowers
- Strengthening of criminal investigations targeting organized match-fixing networks
Under the framework, the Ministry of Sports will coordinate implementation, while the Ministry of Finance will oversee betting regulation and operator compliance. The Ministry of Justice and Public Security, alongside the Federal Police, will lead intelligence-sharing and enforcement efforts, particularly in cases with interstate or international scope. See DOU
A multi-stakeholder governance committee will be responsible for monitoring progress and proposing adjustments, ensuring that the policy evolves alongside the market.
This move reinforces Brazil’s intention to align regulatory oversight with global integrity standards, particularly relevant as the country prepares for high-volume betting scenarios during major international competitions.
![]()
Sportradar expands iGaming strategy with Playradar launch
On the corporate front, Sportradar announced the launch of Playradar, a new brand dedicated to its iGaming vertical, signaling a strategic shift toward more integrated and immersive betting experiences.
The new offering is built around hybrid gaming concepts, combining real-time and historical sports data with live streaming and casino content.
Among the key features is a 24/7 live experience hub, where users can engage simultaneously with sports events and interactive gaming formats.
The initiative will be led by Edo Haitin, a seasoned executive with over two decades of experience in live gaming and product development.
The company plans to roll out Playradar starting in 2026, initially targeting regulated markets in the UK, North America and Latin America.
According to CEO Carsten Koerl, the move represents a natural evolution of the company’s capabilities, leveraging its existing infrastructure in data, streaming and user behavior analytics to enhance engagement and monetization across the player lifecycle.
Haitin also emphasized the strategic vision behind the launch, highlighting the ability to combine technology and content in line with evolving market demands, particularly as operators look for differentiated and immersive user experiences.
Importantly, Playradar will operate exclusively in regulated environments, maintaining a strong focus on responsible gaming and integrity, aligning with broader industry and regulatory trends.
Playson strengthens Brazilian footprint through Betnacional partnership
Further reinforcing Brazil’s position as a high-growth market, Playson expanded its regional presence through a new partnership with Betnacional, a leading local operator owned by Flutter Entertainment.
The agreement will see a portfolio of Playson’s top-performing titles integrated into Betnacional’s platform, including 4 Pots Riches, Diamonds Power, and Sugar Teddy x1000, all recognized for their strong performance in regulated markets and engaging gameplay mechanics such as Hold and Win.
The partnership reflects a broader industry trend toward localization and mobile-first strategies, as operators seek to better align content with regional player preferences.
Cristhian Zito, Head of LatAm at Playson, highlighted the strategic importance of the deal:
“Partnering with Betnacional is an important milestone for us in Brazil. It is a highly respected local brand with a deep understanding of its audience, and we are confident our content will resonate strongly with its players.
This launch further strengthens our position in the market and reflects our commitment to delivering engaging, high-performing games to operators across Latin America.”
From the operator’s perspective, Frederico Cunha, Head of Commercial at Betnacional, also emphasized the value of the collaboration:
“We are delighted to welcome Playson’s portfolio to Betnacional. Their games are recognised for their quality, strong mechanics, and consistent performance, making them a valuable addition to our offering.
We look forward to working closely together and bringing an enhanced entertainment experience to our players.”
A market balancing integrity and growth
Taken together, this week’s developments illustrate a clear dual trajectory in Brazil’s betting sector: strengthening institutional and integrity frameworks while simultaneously attracting investment, innovation and international partnerships.
As regulatory structures become more sophisticated and collaboration between stakeholders deepens, Brazil is positioning itself not only as a compliant and secure market, but also as a central hub for growth in Latin America’s gaming industry.
SportyBet appoints DJ Khaled as global ambassador to expand connection between sports, culture and entertainment
SportyBet has announced DJ Khaled as its new global ambassador, strengthening its positioning at the intersection of sports, music, and contemporary culture.
He joins a global roster that includes José Mourinho and Éder Militão, reinforcing the company’s strategy of connecting with audiences through entertainment. The partnership will roll out across key markets such as Brazil, the United States, Mexico, and parts of Africa, supporting SportyBet’s expansion as an experience-driven platform.

According to Elias Gallego, Vice President of Sporty Group, the collaboration reflects the company’s focus on partnering with culturally relevant figures to engage diverse audiences, particularly in markets like Brazil where sports and lifestyle are closely linked.
Deeper push into music and entertainment
The move also signals a broader effort by Sporty Group to integrate music into its entertainment ecosystem. Earlier this year, the company partnered with Burna Boy on the “For Everybody” project, blending music, football, and global culture.
In this context, DJ Khaled’s appointment further strengthens a strategy centered on storytelling and fan engagement, especially in regions where sports and music are deeply connected.
Global mindset and brand evolution
DJ Khaled highlighted the shared vision behind the partnership, emphasizing mindset, authenticity, and global connection with fans.
The agreement reinforces SportyBet’s evolution beyond sports betting, positioning the brand within a broader entertainment ecosystem. In Brazil, it aligns with the company’s ongoing growth and its focus on delivering integrated experiences that combine content, culture, and user engagement.
The post Brazil advances integrity agenda amid strong market growth appeared first on Americas iGaming & Sports Betting News.
affiliate automation
ReferOn Shortlisted for “Best Affiliate Software 2026” at SiGMA Awards South America

ReferOn, the next-generation affiliate management platform, has been shortlisted for the “Best Affiliate Software 2026” category at the upcoming SiGMA Awards South America.
The nomination recognises ReferOn’s continued growth and the platform’s ability to support operators with scalable, transparent, and efficient affiliate management solutions in increasingly complex markets.
ReferOn has become a trusted foundation for businesses worldwide looking to scale their operations. With rapid adoption across the globe, the platform is now the go-to choice for companies that need to scale quickly and reliably. Because the platform handles large volumes of data with ease, it is a vital tool for teams that need speed and precision. In such a competitive market, we provide the accuracy and simplicity required to stay ahead, allowing our users to focus on their goals without the technical stress.
A New Chapter: The Era of “Refie”
This nomination arrives at a defining moment for the company, after the 2025 launch of Refie, the latest evolution of ReferOn. We have humanized B2B software with Refie, an integrated assistant that acts as a helpful navigation layer for our users. This milestone completely removed the struggle of getting started on the platform by visually guiding people through complex steps, making sure everyone can find their way without any stress or confusion.
Refie transforms repetitive daily tasks into an engaging experience that actively minimizes human error. It was specifically designed to eliminate the manual bottlenecks affiliate managers have traditionally faced, making their daily operations much faster and more efficient.
Alex Bukin, General Manager at ReferOn, commented: “Being shortlisted for the SiGMA Awards South America is a strong recognition of the progress our team has made. We are focused on building technology that simplifies affiliate management and gives operators clearer, faster access to the data they need to grow. With Refie and our upcoming developments, we’re continuing to move in that direction”.
Ambitious Plans for 2026
In 2026, ReferOn will upgrade Refie with sophisticated gamification to boost user engagement and streamline daily tasks for affiliate managers. These updates will introduce personalized, smart features, establishing a new industry benchmark for affiliate technology.
Cast Your Vote
We invite all industry peers and partners to support the work we’re doing. If you are a registered delegate attending SiGMA South America 2026, your voice matters.
- Award Category: Best Affiliate Software 2026
- How to Vote: Voting is open exclusively to delegates who hold valid event tickets. Please visit the official SiGMA Awards portal to cast your vote for ReferOn.
The post ReferOn Shortlisted for “Best Affiliate Software 2026” at SiGMA Awards South America appeared first on Eastern European Gaming | Global iGaming & Tech Intelligence Hub.
Latest News
ELA Games Contributes to Discussions on Scalable iGaming Ecosystems and Studio Innovation at HIPTHER Prague Summit

ELA Games recently took the stage at the HIPTHER Prague Summit, joining top industry leaders to discuss the rapidly evolving landscape of the iGaming sector. Represented by Yaroslav Soloshenko, Head of Business Development, the studio participated in a forward-looking panel focused on building a more scalable iGaming ecosystem and advancing game innovation for 2026 and beyond.
Rather than just looking at incremental changes, the panel challenged speakers to envision an ideal, universal platform of the future before tackling everyday industry challenges. From there, the conversation shifted to real-world strategies, exploring how enhanced operator-supplier collaboration, gamification, and advanced platform architecture will shape the next generation of iGaming.
One focus of the session was the ongoing evolution of game development and distribution. The group highlighted the necessity of building bespoke, trust-based relationships with operators to secure the best visibility in increasingly crowded game libraries. Tied to this was the critical importance of early operator feedback and MVP (Minimum Viable Product) testing, with panelists noting that smaller studios often have a distinct advantage in implementing operator-driven changes faster than larger competitors.
The topic of artificial intelligence was also raised, with the point made that some studios already have proof-of-concept for fully AI-generated slots. This led the panelists to tackle the relationship between AI and traditional game design, weighing the balance between mass-produced, AI-generated content and the slower, human-led craftsmanship required to build higher-value games.
Addressing the realities of market distribution, the panel discussed how operators are becoming much stricter about the number of games they release to prevent market oversaturation. They also examined how rigorous testing rules in regulated regions can significantly delay product launches. Weighing in on these challenges, Soloshenko brought ELA Games’ forward-thinking perspective to the table, advocating for the ideal of a single global license to reduce regulatory barriers and accelerate market entry.
During the session, Soloshenko emphasized the necessity of uniting departments to achieve complete, A-to-B game design. He stressed the fundamental alignment required between product and business teams, noting that because the business division operates on the frontline of the market—tracking industry changes and operator demands—they must actively help guide the product’s direction. To achieve this, he advocated for transitioning away from a factory-line style of production in favor of a “boutique” approach, where all teams collaborate intimately from the initial project kick-off all the way to release day.
“Participating in the HIPTHER Prague Summit gave us a great opportunity to explore how development strategies must adapt to current industry realities,” said Yaroslav Soloshenko, Head of Business Development at ELA Games. “The foundation of our approach is continuous collaboration, both internally and externally. By working as closely as possible with operators to share early MVPs, we gather invaluable feedback. When those insights are handed directly to a unified development team, it allows us to consistently develop titles crafted exactly for what the market needs at any given time.”
Being a part of these high-level industry talks is part of ELA Games’ strategy to remain closely aligned with operator needs and player expectations as the market evolves.
Play the demo and other games here: www.elagames.com/our-games
The post ELA Games Contributes to Discussions on Scalable iGaming Ecosystems and Studio Innovation at HIPTHER Prague Summit appeared first on Eastern European Gaming | Global iGaming & Tech Intelligence Hub.

-

 bingo5 days ago
 -
Africa7 days ago
Virgin Bet goes live in South Africa
-
Charity Space Scotland7 days ago
Scottish Government Announces £7.9M Investment to Tackle Gambling Harms
-
BetMGM6 days ago
PA Gaming Control Board Imposes $100,000 Fine on BetMGM
-
ELA Games6 days ago
2026 SiGMA Americas Awards Features ELA Games in Two Major Categories
-
apuestas6 days ago
Brasil 2026: Bets presionan el presupuesto de los hogares y redefinen la competencia por el consumo
-
Compliance Updates7 days ago
Peter Knutsson Becomes New Director General of Swedish Gambling Authority
-
Compliance Updates6 days ago
EGBA Urges EC to Tackle Rising Online Fraud in Gambling Sector