Latest News
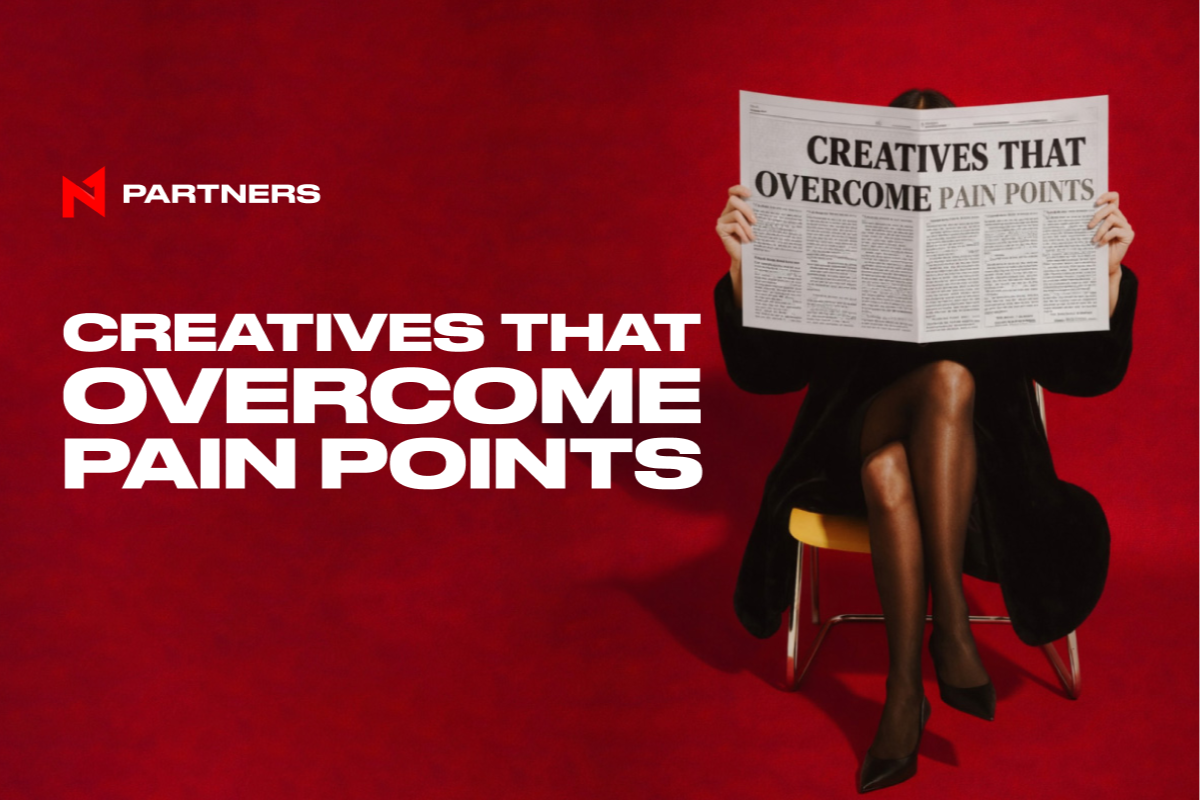
Creatives That Overcome Pain Points: Affiliate Case Studies By N1 Partners
What mistakes do partners most often make when launching and scaling ad campaigns?
What real challenges do they face in day-to-day work, and what prevents them from achieving stable results?
In this case study series by N1 Partners, we break down real affiliate campaigns, highlight common pain points in affiliate marketing, and show how partners find practical solutions that lead to measurable success.
This edition focuses on ad creatives. No abstract “best practices” – only concrete mechanics, insights, and ideas you can apply to your campaigns right away.
The cases were shared by Bogdan Solodushchenko, Affiliate Team Lead, and Dmitrii Filippov, Affiliate Team Lead (SEO).
CASE 1 (Facebook Traffic)
Context
- GEO: DE
- Traffic source: Facebook
- Brand / vertical: N1Bet
- Campaign goal: Increase conversion
Initial Challenge (Pain Point)
- What wasn’t working in the creatives?
The creatives showed a low conversion rate from registration to first deposit.
- Was the issue related to format, messaging, visuals, or the offer?
Primarily to the information shown in the creatives and the creative format itself.
What the Data Revealed
- Which metrics indicated the problem?
Low reg-to-dep conversion.
- Where did the funnel break?
At the creative level and during audience targeting.
What Was Tested
- Visuals
Aggressive, dynamic video creatives with slot gameplay.
- Messaging (emotional vs rational)
High aggression and heavy use of triggers.
- Focus: bonus / product / UX
Emphasis on the bonus and a female character in video creatives.
Decision Made
What was changed in the creatives?
- Updated the bonus and featured a top-performing slot with proven product quality
- Added a dedicated promo code directly into the creatives
- Refocused targeting on the most active audience segments, segmented by gender, average age, and peak activity time slots during the week
Why this approach was chosen?
Users were not getting what they came for after landing on the product.
The promoted slot wasn’t visible, the bonus was outdated, and the product’s visual style didn’t match the creative – all of which created a mismatch in expectations.
Results
-
- What improved?
Reg2dep increased from 8% to 22%.
- What improved?
- How quickly did the results appear?
Almost immediately – visible within 4–5 days after relaunching the test.
Key Takeaway
- What worked best?
A full creative overhaul aligned with the actual product, which helped meet real player expectations. - Is this scalable?
Absolutely. Once a winning creative format is identified, we scale through variations – tweaking individual elements while preserving the core message and logic.
CASE 2 (PPC Traffic)
Context
- GEO: CA
- Traffic source: PPC Direct (Ice Fishing keywords)
- Brand / vertical: RollXO
- Campaign goal: Increase conversion
Initial Challenge (Pain Point)
What wasn’t working?
Most traffic came from Ice Fishing slot keywords, but the slot wasn’t available on the homepage. Users came specifically for that game, couldn’t find it immediately, and quickly lost interest.
Was this about format, messaging, visuals, or the offer?
The issue was primarily the incorrect landing page choice.
What the Data Revealed
Which metrics signaled the issue?
Lower reg2dep compared to similar traffic sources.
Where did the funnel break?
At the landing page selection stage.
What Was Tested
Visuals
Ice Fishing slot keywords.
Messaging
Pure slot-focused keywords.
Decision Made
What was changed?
Traffic was redirected straight to the demo version of the slot, and the game was also added to the homepage.
Why this approach was chosen?
Users interested in a specific game want immediate access, not extra steps inside the product.
Results
What improved?
Reg2dep increased by 8%.
How fast did the impact show?
Almost instantly – positive dynamics were visible within a couple of days.
Key Takeaway
What worked best?
Switching to a highly relevant, thematic landing page. Players landed directly on the demo and got exactly what they were looking for.
Is this scalable?
Yes – the approach can be scaled within the campaign and tested across other slots and games.
Quick Q&A
If you were launching these campaigns today, what would you do differently?
Bogdan Solodushchenko:
I’d take a more structured approach from day one: clarify with the manager what’s currently performing best, which audiences respond strongest, which top slots to use, and which bonuses convert best. And if campaigns lead to a specific slot, I’d ensure it’s immediately accessible on the product.
Key conclusions from these cases?
Bogdan Solodushchenko:
There’s no universal approach. Targeting and creatives must be customized per offer, because not every product supports the same funnel logic.
Who are these cases most useful for?
Bogdan Solodushchenko:
For all partners. New teams can boost conversion, while experienced ones can improve player quality. Personalization impacts both.
CASE 3 (SEO Traffic)
Background
After a major Google core update, conversion from the landing page on the Lucky Hunter brand dropped sharply in the DE GEO. The goal was to quickly find a working setup to retain the partner and preserve traffic volume.
Context
- GEO: DE
- SEO type: Cross-brand
- Brand / vertical: Lucky Hunter casino
- Campaign goal: Increase CR (reg2dep)
Initial Challenge (Pain Point)
What wasn’t working?
Click-to-registration was strong, but registration-to-deposit dropped significantly.
Root cause
The same landing page had been used for a long time, leading to classic creative fatigue.
What the Data Revealed
Which metrics raised red flags?
Very low r2d with strong c2r.
Where did the funnel break?
At the reg-to-deposit stage.
What Was Tested
- Slot-focused landing pages
Decision Made
Traffic was redirected directly to specific slots – not random ones.
After testing multiple options, the best performers were:
- Jetsetter
- Sweet Sugar
- Kenneth Must Die
- Bikini Paradise
Results
Which metrics improved?
R2D increased from 23% to 51%.
Time to impact
Within one month.
Key Takeaway
What worked best?
Fast reaction from the manager: identifying the issue early, flagging it to the partner, and implementing concrete corrective actions.
Is this scalable?
Yes. Creative testing remains scalable, especially as SEO shifts toward content quality rather than aggressive link-building.
CASE 4 (SEO Traffic)
Background
A partner requested a promo code-first setup, where the promo code had priority over tracking links. Traffic was planned from forums, platforms like Reddit, and Google search – both short posts with guides and long-form articles.
Context
- GEO: Worldwide
- SEO type: Parasite SEO
- Brands / vertical: Goldex Casino, Spirit Casino
- Page goal: Traffic from non-standard queries
Initial Challenge (Pain Point)
What wasn’t working?
At the approval stage, promo codes couldn’t be promoted separately without links.
Root issue
Players were not being attributed in stats after entering the promo code.
What the Data Revealed
Which metrics showed the issue?
High CTR but no registrations or deposits.
Where did the funnel break?
At registration.
What Was Tested
- Promo code flows without tracking links
Decision Made
What was changed?
Dedicated landing pages were built for these funnels, with full brand descriptions and clear promo code activation mechanics.
Why this solution?
Together with Product Managers, we analyzed the funnel, ran tests, and selected brands suitable for promo-code-driven traffic.
Results
What improved?
Traffic launched successfully, the hypothesis was validated, and the number of FDs increased.
Time to impact
Within the first two weeks after launch.
Key Takeaway
What worked best?
The promo code performed exactly as the partner expected. Providing the right functionality directly contributed to traffic growth.
Is this scalable?
Yes – we now understand how to properly use promo codes without tracking links and how to correctly track such mechanics.
Quick Q&A
If you launched these SEO campaigns today, what would you change?
Dmitry Filippov:
First, I’d evaluate how the creative performs on the partner’s specific source, not just overall stats. Second, I’d run multiple tests to explore all possible scenarios.
Main takeaway?
Dmitry Filippov:
Regularly review landing page performance and switch to alternatives immediately when performance drops.
Who benefits most from these cases?
Dmitry Filippov:
Teams working with large volumes who may miss isolated traffic drops. The manager’s role is critical – spotting issues early and bringing ready-to-use solutions. From a source and GEO perspective, this applies to any SEO type and any market.
Final Note
These cases once again prove that sustainable growth in affiliate marketing isn’t built on universal formulas, but on attention to detail: traffic source, GEO, product, and real user intent.
Most failures are fixable – the key is spotting the issue in time and doing the work to correct it.
And this is exactly where the N1 Partners affiliate team is always ready to help.
Join N1 Partners affiliate program and become number one in the industry!
The post Creatives That Overcome Pain Points: Affiliate Case Studies By N1 Partners appeared first on Eastern European Gaming | Global iGaming & Tech Intelligence Hub.


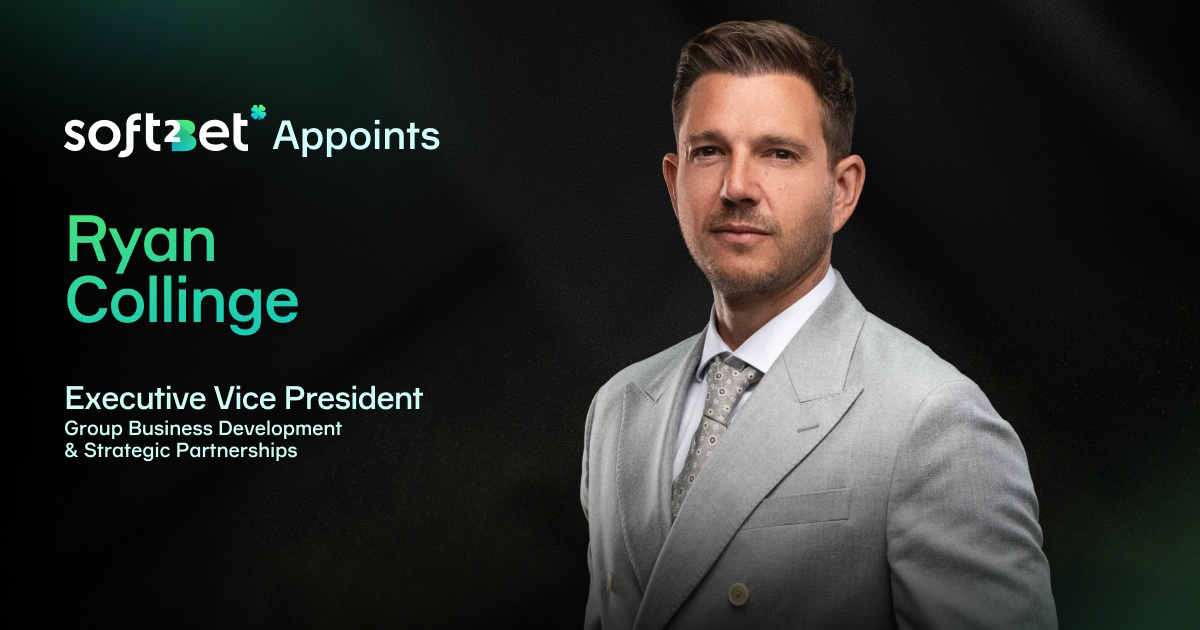
Collinge joins as Executive Vice President – Group Business Development & Strategic Partnerships, bringing 20+ years across retail and online gaming.
Soft2Bet has appointed Ryan Collinge as Executive Vice President – Group Business Development & Strategic Partnerships, adding him to its senior leadership team.
In the role, Collinge will focus on supporting Soft2Bet’s growth plans and strengthening relationships with operators and entertainment brands, the company said.
Andrew Cochrane, Chief Commercial Officer at Soft2Bet, said: “Ryan brings the commercial judgement, industry relationships and operational experience needed to support Soft2Bet’s growth. His appointment strengthens our executive team as we expand our work with leading operators and global entertainment brands.”
Soft2Bet said Collinge brings more than 20 years of commercial, product and operational experience across retail and online gaming, including work with private equity-backed start-ups and multinational gaming groups. The company added that his background includes global sales, commercial strategy and business development, along with iGaming content, product development and studio management.
Soft2Bet also pointed to Collinge’s experience in the casino content vertical, which it said will support client needs analysis and solution optimization.
The post Soft2Bet hires Ryan Collinge as EVP for business development and partnerships appeared first on EE Gaming | Global iGaming & Tech Intelligence Hub.

Caesars Rewards member Pam W. from Colorado hit a seven-card straight flush on the Las Vegas Strip property.
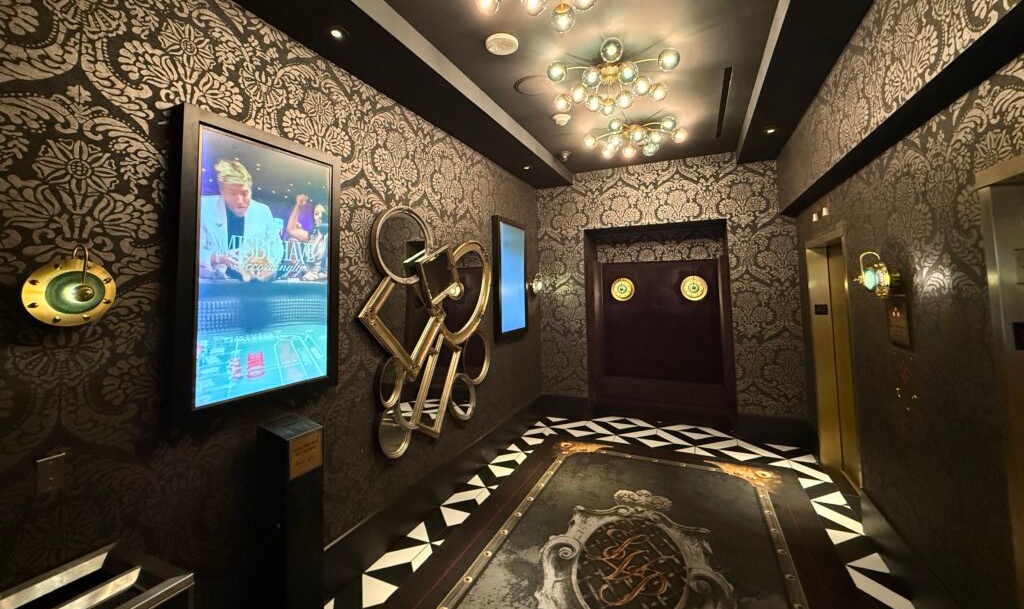
The Vanderpump Hotel on the Las Vegas Strip has reported an $813,553 jackpot win on Pai Gow Poker, just weeks after the property officially opened.
According to the company, Caesars Rewards member Pam W., visiting from Littleton, Colorado, won the payout after hitting a seven-card straight flush while playing Pai Gow Poker at The Vanderpump Hotel. The release said Pam was on a weeklong vacation with her husband and plans to use the winnings toward a European river cruise.
The Vanderpump Hotel is Lisa Vanderpump’s first hotel, developed in partnership with Caesars Entertainment. The property has 188 guest rooms, including 21 suites, and a 40,000-square-foot casino, the company said.
The venue’s food, beverage and nightlife lineup includes GIADA by Giada De Laurentiis, rooftop pool and event space Soleia, and Drai’s After Hours in its original location beneath the hotel. The property also hosts Caesars Sportsbook in a lounge-style format, alongside lounges including Gigolo and The Bar at The Vanderpump Hotel.
The post Vanderpump Hotel reports $813,553 Pai Gow Poker jackpot weeks after opening appeared first on EE Gaming | Global iGaming & Tech Intelligence Hub.
The Vanderpump Hotel – Lisa Vanderpump’s first-ever hotel in partnership with Caesars Entertainment – is dealing out big wins on the Las Vegas Strip, celebrating a dazzling $813,553 payout just weeks after officially opening its doors.
Caesars Rewards® member Pam W., visiting from Littleton, Colorado, hit the jackpot with a seven-card straight flush on Pai Gow Poker at The Vanderpump Hotel. Pam, who is in town enjoying a weeklong vacation with her husband, is already planning her next adventure – turning her Vegas luck into a dream European river cruise.
Blending elevated design with a distinct sense of personality, The Vanderpump Hotel introduces a boutique, lifestyle-driven hospitality experience in the heart of one of the world’s most dynamic destinations. The hotel offers an intimate footprint with 188 guest rooms, including 21 suites.
The property also features a 40,000-square-foot casino; Gigolo, a sexy, sultry lounge and The Bar at The Vanderpump Hotel, an inviting destination in the center of the casino – all curated to deliver a sophisticated yet playful atmosphere.
Culinary and nightlife offerings are anchored by GIADA, the award-winning flagship restaurant from celebrity chef Giada De Laurentiis; Soleia, a 65,000-square-foot rooftop pool and event space with open-air, panoramic views from 11 stories above the Las Vegas skyline; and Drai’s After Hours, located in its original home beneath the hotel. Caesars Sportsbook at The Vanderpump Hotel provides a boutique, lounge-style setting for sports fans and gaming enthusiasts alike. Guests can book stays at The Vanderpump Hotel via the Caesars Rewards app or online at caesars.com/thevanderpumphotel.
The post Raise a Glass: The Vanderpump Hotel Celebrates $813,553 Jackpot Win appeared first on Americas iGaming & Sports Betting News.

-

 content-supply6 days ago
Million Games launches Skull King’s Treasure with partner studio Arcane Pixel
-
Africa6 days ago
Booming Games renews Hollywoodbets Durban July activation partnership
-
Alberta7 days ago
Octoplay secures conditional Alberta iGaming supplier approval from AGLC
-
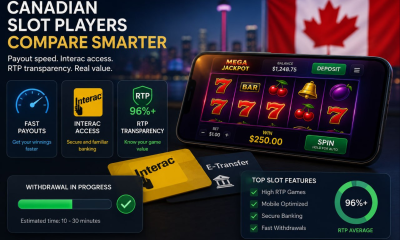
Canada7 days ago
What Canadian Slot Players Are Really Comparing in 2026: Payout Speed, Interac and RTP Transparency
-
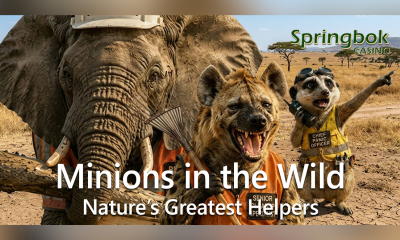
Africa5 days ago
SpringbokCasino ties July free spins to ‘Minions in the Wild’ campaign
-
Casino Content7 days ago
SkillOnNet adds ODDSworks casino content across Ontario sites
-
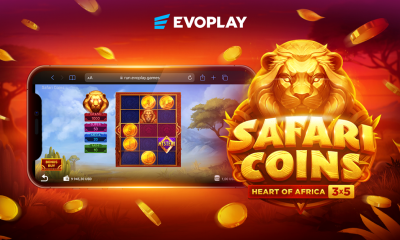
Evoplay6 days ago
Evoplay launches Safari Coins slot with fixed jackpots and collector mechanic
-
GGPoker6 days ago
GGPoker opens satellites for WSOP Circuit CDMX México 2026